Earnings Per Session Beats Conversion Rate
Earnings per session is revenue divided by visits. It equals the share of visitors who buy times the average order size. Judge every page test on it, because conversion rate counts buyers and ignores what they spend.
A visit should earn more than a click costs. Run tests at least 7 days, call winners at 14, stop by 30.
Earnings per session catches the winner that loses money
Picture a store testing a discount banner. Version B shows 25 percent off. Version A is the page as it stands.
Two weeks later, 3.6 percent of B's visitors buy. On A, 3.0 percent buy. Someone posts it in the team chat with a trophy.
The banner goes live for everyone. Next month, revenue is down. Nobody can say why, because the conversion rate is still up.
The banner got more people to buy. It also made each order smaller. Earnings per session would have caught that.
Earnings per session is the money a page makes per visit. You get it by dividing revenue by visits. It sees how many people buy and how much they spend, at once.
In this example, B earned $1.37 per visit. A earned $1.50. The trophy went to the loser.
We judge every page test on that one number. We call it the Visit Value Rule. Below, we show the math, two money lines, and when to stop a test.
Example: the discount won on buyers and lost $132 per 1,000 visitors
| Per 1,000 visitors | Version A, no banner | Version B, 25% off |
|---|---|---|
| Share who buy | 3.0% | 3.6% |
| Orders | 30 | 36 |
| Average order | $50 | $38 |
| Revenue | $1,500 | $1,368 |
| Money per visit (EPS) | $1.50 | $1.37 |
Worked example: orders x average order = revenue; revenue / 1,000 visits = EPS. Numbers are ours, for illustration.
The version with more buyers earned less per visit
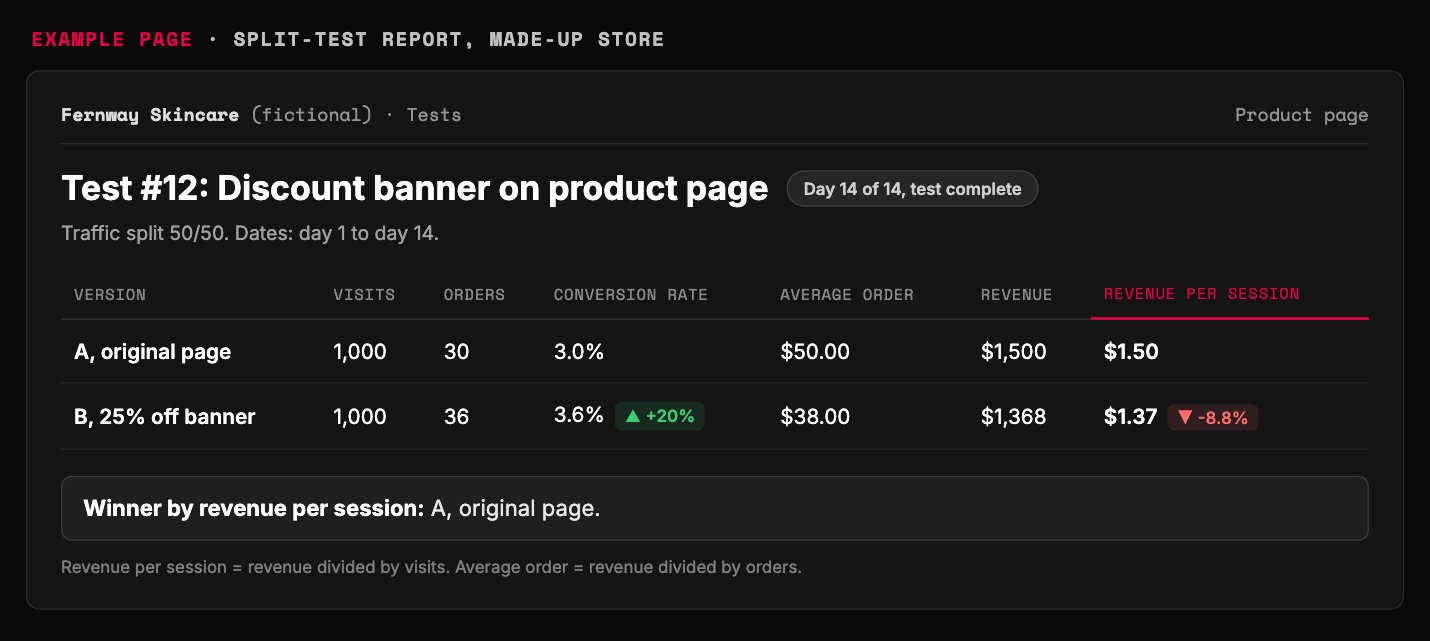
- More people bought. This is the number that got the trophy.
- Each order shrank by $12. The discount paid for the extra buyers.
- $132 less than A, from the same 1,000 visits.
- Revenue divided by visits. Judge the test here.
- The original page wins: $1.50 per visit against $1.37.
Example page built for this article with a made-up brand
How do you calculate earnings per session?
Divide the revenue a page made by the visits it got. Same page, same dates. That is the whole formula.
A visit is one person arriving and looking around. Google Analytics, by default, ends one after 30 minutes of no activity. So one person can make two visits in a day.
There is a second way to get the same number. Multiply conversion rate by average order value. Both ways give you the same number.
Conversion rate is the share of visitors who buy. Average order value is what an order is worth, on average. We shorten the result to EPS.
Example: 3 percent of visitors buy, and the average order is $50. Each visit earns $1.50. At 4 percent and $80, each visit earns $3.20.
Think of a shop on a busy street. Count everyone who walks in, buyers and window shoppers. Then ask how much money the whole crowd left behind, per person.
Window shoppers count as zero. That is the point. A page that pulls in more window shoppers looks busy and earns less.
Some testing tools label it revenue per session. Ad platforms show earnings per click. That is close, but not the same, and we explain why below.
Example: 3 percent of visitors at $50 an order earns $1.50 per visit
- Share of visitors who buy 3
- Average order value 50
- Earnings per visit: 3% x $50 1.5
Worked example: conversion rate x average order value. The math is ours.
Example: the discount version earned 13 cents less per visit
Revenue divided by visits, for the two versions in the discount example
- Version A, no banner 1.5
- Version B, 25% off 1.37
Worked example: $1,500 and $1,368 divided by 1,000 visits each.
The Visit Value Rule judges every page and every test on earnings per session: revenue divided by visits, which equals conversion rate times average order value. A visit must earn more than its click costs, and an average order must be worth more than a sale costs in ads. Check the split, never edit a live page, cut a clear loser no sooner than day 7, call a winner at day 14, and stop by day 30.
Why conversion rate alone picks the wrong winner
Conversion rate counts how many people bought. It never asks how much they spent. So any change that trades order size for more orders can fool it.
Discounts do it. So do cheaper bundles. So does dropping the add-on from the cart.
It works the other way too. Raise a price, and fewer people may buy while each order gets bigger. Conversion rate calls that a loss even when the page earns more.
That makes price the classic EPS test. For example, test $27 against $3. One may win on buyers and the other on order size, and only EPS can settle it.
Which version made more money per visit? That is the only question a page test has to answer.
The whole field is called conversion rate optimization. The name points at the wrong number. The goal was always the money.
Our take: conversion rate is a fine clue. It is a terrible way to pick the winner.
When buyers and order size move in opposite directions, only EPS can decide
- Check EPS Discounts and cheap bundles land here. Can win or lose.
- Clear win More buyers and bigger orders. Ship it.
- Clear loss Fewer buyers and smaller orders. Cut it.
- Check EPS Price raises land here. Can win or lose.
Our decision grid for the Visit Value Rule.
Conversion rate counts the buyers; EPS counts the money
| What conversion rate sees | What EPS sees |
|---|---|
| 36 orders beat 30 | $1,368 lost to $1,500 |
| A discount that brings more buyers | A discount that shrinks every order |
| A price raise that loses buyers | A price raise that may earn more per visit |
| How many bought | How many bought, and how much they spent |
Discount example from this guide. Our comparison.
Check two money lines: cost per click and cost per sale
EPS alone does not tell you if your traffic pays. For that, put it next to two numbers from your ad account.
Line one: EPS above cost per click. Cost per click is what you pay each time someone clicks your ad. A visit that earns $1.50 can pay up to $1.50 for the click that brought it.
Line two: average order value above cost per sale. Cost per sale is your ad spend divided by your sales. If an average order is $50, a sale cannot cost more than $50 in ads.
Both lines are break-even floors. They are not profit. Your product, shipping and staff still cost money.
For the ceiling that leaves you a profit, use max allowable CPA.
Why judge the page per visit and not per click? Because click numbers keep changing.
A buyer clicks an ad, leaves, then comes back days later from an email or a retargeting ad. The platform credits that sale back to the old click. So earnings per click can change days after the click.
That can move earnings per click by something like 10 to 20 percent. A visit is counted once, when it happens. That makes it the cleaner number for judging a page.
So judge ads per click and pages per visit. For the ad side, see which ad metric is broken and what to fix.
Judge ads per click and pages per visit
- Earnings per impression Money per ad view. Useful for judging ads at large scale.
- Earnings per click Money per ad click. Updated later when buyers return through email or retargeting.
- Earnings per visit (EPS) Counted once, when the visit happens. The cleanest number for judging a page.
The Visit Value Rule. Per click can drift by something like 10 to 20 percent as returning buyers get credited.
A visit must earn more than its click; an order must be worth more than its sale
| Line | Compare | Passes when | Example |
|---|---|---|---|
| Line one | EPS vs cost per click | A visit earns more than its click costs | $1.50 per visit pays for clicks under $1.50 |
| Line two | Average order vs cost per sale | An order is worth more than the ads it took | A $50 order pays for sales under $50 in ads |
Break-even math, not profit. For a profit ceiling, see max allowable CPA.
How long should you run an A/B test? Four stop rules
Aim for about 1,000 visits per page, 2,000 if you can. Run at least 7 days, call a winner no sooner than day 14, and stop by day 30.
An A/B test shows two versions of a page to similar visitors at the same time. These four rules are rules of thumb for small and mid-size traffic. Here is why each one exists.
Rule 1: about 1,000 visits per page. Below that, a handful of buyers can swing the result. A statistician would work out the exact sample size; 1,000 is our floor.
Rule 2: 7 days minimum. Three days might all be Monday to Wednesday. A full week catches the weekend too.
By day 7 you hope for about 500 visits per version. Then you may cut a clear loser. You still have not found a winner.
Rule 3: 14 days to call a winner. Two weeks cover two weekends and every time of day. They also catch more of the season's swings.
Rule 4: never past 30 days. By then, many visitors are on their second or third visit. Returning visitors blur which version did the selling.
The hardest day is day three. A new version takes off, and you want to call it. Don't.
New things often get a burst of attention that fades. It has a name: the novelty effect. Wait it out.
How to crown a fake winner in four easy steps:
1. Judge it on conversion rate. Ignore order size.
2. Check on day three. Call it while you are excited.
3. Run it for two months, to be extra sure.
4. Tweak the live page halfway through. Then act surprised when nobody can explain what the hell happened.
That is not a test. That is a coin toss with a dashboard.
Cut a loser at day 7, call a winner at day 14, stop by day 30
- Start Day 0 Write the hypothesis. Put the day 14 and day 30 dates in your calendar.
- Hands off Day 3 An early lead is often noise or novelty. Do nothing.
- Cut a clear loser Day 7 About 500 visits per version by now, if traffic allows.
- Call the winner Day 14 Two full weeks, two weekends. Pick the higher EPS.
- Hard stop Day 30 Returning visitors start to blur the result.
The Visit Value Rule stop rules. Rules of thumb for small and mid-size traffic.
Four numbers decide when a page test is done
- Visits per page to aim for (2,000 is better) 1000
- Minimum before cutting a clear loser 7
- Earliest day to call a winner 14
- Latest day to stop 30
The Visit Value Rule stop rules. Rules of thumb, not a statistics formula.
Clean numbers first: check the split and never edit the live page
A test is only as good as its counts. Three checks keep them honest.
Check the split. Before a real test, send traffic to two copies of the same page. This is called an A/A test.
Both copies should get about the same visits. For example, if A gets 200 visits on a 50/50 split and B gets 40, the tool is broken. Fix it before you test anything.
Never edit the live page. Every change goes in as a new version, tested against the old one. Edit the page directly and you lose the before and after.
Check revenue in a second place. Funnel tools can miscount returning visitors. For example, one funnel showed 3 page views and 5 sign-ups, a 166 percent sign-up rate.
So match the revenue in your testing tool against your payment processor or store records. Web analytics tools count in different ways. If two sources disagree, trust neither until you know why.
Do you need expensive testing software? No. You can copy the page, keep the same ad audience, and split the traffic 50/50.
Test one change at a time when traffic is low. Change two things at once, and you cannot tell which one moved the money. The same rule works for ads: test one variable at a time.
Example: a 50/50 split that sends 200 and 40 visits is broken
Visits to two identical copies of one page, with the tool set to split traffic evenly
- Copy A 200
- Copy B 40
Example numbers. A healthy split sends about the same visits to each copy.
Four checks before you believe any test result
- 1. Run an A/A test Two copies of one page. Visits should come out about even.
- 2. Lock the page Changes go in as a new version, never as an edit.
- 3. Match revenue Testing tool against payment processor or store records.
- 4. One change at a time On low traffic, two changes hide which one worked.
The Visit Value Rule, data checks.
Learn from the losers, then watch the buyers
Most tests lose. That is normal. It is also cheap.
For example, one business ran five tests: three losers and two winners. It still came out ahead overall, because the winners paid for the losers.
So before each test, write down why you expect it to win. That is your hypothesis. When it ends, write down why it won or lost.
A loss with a reason is a lesson. A loss without one is just a bill.
Where do good reasons come from? Watch real people use the page.
Microsoft Clarity is free. It records visits and shows where people scroll and tap. You can filter the recordings down to visits that ended in a purchase.
Then look for what buyers did that non-buyers did not. Also look for dead clicks and rage clicks: taps on things that do nothing, and fast repeated taps from people getting frustrated.
Test the big swings first: price and page format, then headlines. Button colors come last, if ever. For a page that keeps losing, start with a conversion-first audit.
Example: one row of a test log, judged on money per visit
| Change | Why we expect a win | Control EPS | Variant EPS | Result |
|---|---|---|---|---|
| New headline (example) | It repeats the ad's promise | $1.34 | $1.45 | Winner. Log why it won, then plan the next test. |
EPS figures are an example from another business's test plan. Not our results.
Test the big swings first: price and format before headlines
- Colors and buttons Last, if ever. Small swings need huge traffic.
- Trust and calls to action Guarantees, testimonials, the words on the buy button.
- Hero image or video Show how it works.
- Headlines The first promise on the page.
- Price and page format The biggest swings. Test these first.
Our test order for the Visit Value Rule, bottom to top.
Learn the three frustration signals before you watch a single recording
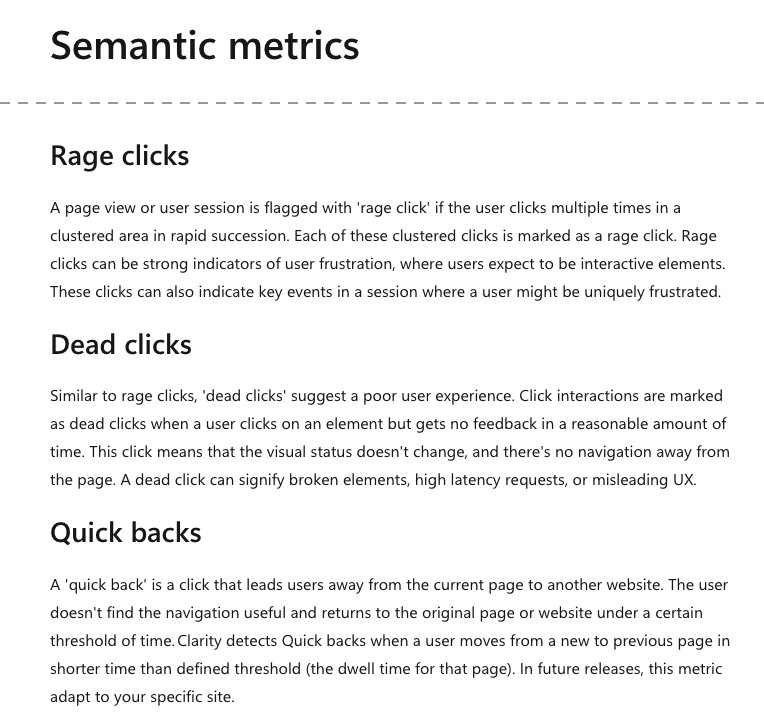
- Free documentation for the free Clarity tool. Read it once before you watch recordings.
- Rage click: fast repeated taps in one spot. Someone expected something to happen.
- Dead click: a tap that does nothing. Make that thing work, or stop it looking clickable.
- Quick back: someone clicks away, then comes right back. The link did not give them what they wanted.
Screenshot of Microsoft Learn, Clarity semantic metrics page, taken 2026-10-17
When the page pays, raise the order size next
Once EPS sits above cost per click, stop tweaking the first page. Work on what buyers do after they buy.
An add-on after checkout, a second product or a monthly plan all raise average order value. That lifts EPS without a single extra buyer.
The first page after checkout matters most. Many buyers leave it at once. Give them a reason to stay, like a short first lesson on getting the most from what they just bought.
Is your first page losing money? Then fix it first. For example, if each $1 of ads brings back 50 cents, there is nothing to build on yet.
More on offering the next step after a sale and checkout fixes that raise money per visit.
Fix a losing first page; grow order size on a paying one
| First page losing money | First page paying |
|---|---|
| EPS below cost per click | EPS above cost per click |
| Example: $1 of ads brings back 50 cents | Every visit covers its click |
| Fix the offer, headline and price | Add add-ons, second products, monthly plans |
| Hold off on upsells | Start with the first page after checkout |
The Visit Value Rule. The 50 cents example is ours.
Run the Visit Value Rule with AI
Paste the prompt below into your preferred AI. It asks for your visits, orders, revenue and ad costs. Then it picks the winner by EPS, checks both money lines, and tells you if the test is too early.
It never invents a number. If something is missing, it asks you.
1. This week, pull visits, orders and revenue for your top page. Work out its EPS.
2. Put it next to your cost per click. Pass or fail?
3. Set up your next test with three dates: start, day 14 and day 30.
Remember the discount banner? It took the trophy and lost $132 per 1,000 visitors. Dividing revenue by visits in the test report would have caught it.
Want a second pair of eyes on your numbers? Send them to us.
Selling through sales calls instead of a cart? Start with book-a-call math.
Conversion rate counts the people. Earnings per session counts the money.
Paste into your preferred AI. It asks for your visits, orders, revenue and ad costs, then picks the winner, checks both money lines and tells you if it is too early.
Act as a conversion analyst. Judge my page or split test with the Visit Value Rule.

Ask me one at a time, with the example:
1. What do you sell, and which page is this? (Example: a $50 skincare kit, product page)
2. For each version: visits, orders and revenue, same dates. (Example: A 1,000 visits, 30 orders, $1,500. B 1,000 visits, 36 orders, $1,368)
3. Your cost per click and cost per sale from your ad account, same dates. (Example: $1.20 per click, $40 per sale)
4. When did the test start, and what split did you set? (Example: 9 days ago, 50/50)

Never invent a number. If a figure is missing, ask me for it.

Rules:
- Earnings per session (EPS) = revenue / visits = conversion rate x average order value. Show both.
- The winner is the version with the higher EPS. Never pick on conversion rate alone.
- Line one: EPS above cost per click. Line two: average order value above cost per sale. Both are break-even floors, not profit.
- Split check: on a 50/50 split, visits per version should be close. If they are far apart (example: 200 and 40), stop and fix the tool first.
- Stop rules: aim for about 1,000 visits per page, 2,000 is better. Run at least 7 days before cutting a clear loser. Call a winner no sooner than day 14. Stop by day 30.
- If the page was edited during the test, say the result cannot be trusted.
- If numbers look odd (example: more sign-ups than visits), ask me to check revenue against my payment processor or store records.

Show your math, then answer:
EPS: A $ / B $
Winner, or "too early" and why
Line one: pass or fail
Line two: pass or fail
Data check: split, edits, odd numbers
Next test, and whether it should raise buyers or order size
Next three actions: 1. 2. 3.

Filip Kovacevic is the founder of Anar Agency in Phoenix. He spent five years running SEO, Meta ads, email, and content for medical practices across the United States, and now does the same work for healthcare, home-service, legal, and professional-service businesses, alongside AI implementation. More from Filip →
Talk it through in 15 minutes
Bring one question from this article. We will tell you what we would do, whether or not you hire us.
Book a 15-Min Chat →