Reading Ad Data: Which Metric Is Broken and What to Fix

To read Facebook ad data, give every step its own rate: ad to click, page to checkout, checkout to sale, sale to the next offer. Compare each rate with a normal range, like about 30 percent at checkout. Fix the step that falls short, one change at a time, starting with the words.
Facebook ads metrics to watch: one rate for each step
Your ad got 2,000 clicks last week. You made six sales. Somewhere between the click and the card, almost everyone left.
Which step lost them? The ad account will not tell you. It shows forty columns and lets you guess.
Most lists of Facebook ads metrics to watch hand you twenty acronyms. We give you one rate per step, a floor to compare it with, and one question about why people stop.
The Metric Read is our way to read ad data one step at a time. Give each step a rate. Compare it with a floor, the lowest normal rate for that step.
Then label the drop as curiosity or intent. Fix one step. Leave the rest alone.
The steps are the walk a stranger takes. Ad, page, checkout, then the offers after the sale. A rate is the share of people who make it to the next step.
That is the whole method. The rest of this guide is how to read each rate without fooling yourself.
Five moves turn forty columns into one step to fix
- List the steps Ad, page, checkout, then each offer after the sale.
- Give each a rate People who moved on divided by people who arrived.
- Compare with a floor About 30 percent at checkout, for example.
- Label the drop Curiosity or intent. Why did they stop?
- Fix one step One change, then wait for 10 to 30 sales.
The Metric Read, as set out in this guide.
Why do people stop? Curiosity or intent
People stop at a step for one of two reasons. They were only curious, or their intent ran out.
Curiosity means "there might be something in this for me." They click to look. They do not yet see why it is worth their time or money.
Intent means they can already picture using the thing. In their head, they own it. Paying is just paperwork.
Neutral comes before both. They see you and feel nothing. Nobody buys from neutral.
Here is the odd part. People do not want to spend money. They want a fair trade, and they pay when what they get feels worth more than the money.
So at every step, ask one question. Are we building intent here, or just feeding curiosity?
For example, one fitness coach bought leads for about $20 each, which is cheap in that market. Almost nobody showed up for the calls. An offer to book a free call sat right under the sales video.
People booked without watching the video. They were curious, not ready. The fix was to hold the booking link back until the video had built some intent.
Cheap curious leads cost you twice. Once for the lead, and again for the empty call. Our guide to getting booked calls to show up covers the second half.
People only pay from intent, and most stop at curiosity
- Neutral They see you and feel nothing. You are not relevant to them yet.
- Curiosity There might be something in it for them. Not worth their time or money yet.
- Intent They can picture using it. The trade feels worth it.
The Metric Read, as set out in this guide.
Curious people look; people with intent act
| Curiosity | Intent |
|---|---|
| Clicks to see the price | Clicks to buy |
| Books a call without watching the video | Books after the video, and shows up |
| Cannot picture using it | Already pictures using it |
| Leaves at the first surprise | Pushes through a long form |
Our comparison, from the Metric Read.
The Metric Read gives every step from ad to upsell its own rate and compares it with a floor: about 30 percent at checkout, 20 to 25 percent on the first upsell, 8 to 15 percent on a short sales page, 1 to 3 percent on a sales video. Each drop is labeled curiosity or intent. A page under 1 percent is a words problem and goes first; otherwise fix from the back.
Check that a split test was fair before you trust it, and wait for 10 to 30 sales before judging.
Compare each rate with a floor before you call it broken
A rate means nothing alone. Is 18 percent at checkout good? Only a floor can say.
Here are the rough floors we use for a small online offer. That means one low-price product, one sales page, and more offers after the sale.
Checkout: about 30 percent of people who reach it should pay. At least a third. Under that, something on the page is in the way.
Sales page: 8 to 15 percent of visitors buy on a short page with buy buttons all the way down. A sales video page runs 1 to 3 percent. A long text page runs about 1 to 5 percent.
After the sale: 20 to 25 percent take the first upsell, an extra offer shown right after they buy. 10 to 15 percent take its downsell, a cheaper version offered after a no. The second upsell gets 5 to 10 percent, and its downsell 3 to 7.
Do these fit a local service with a booking form? No. Pull your own last 30 days, write your rates down, and use them as your floor.
Several steps under the floor? Fix from the back first: upsells, then checkout, then the sales page. Every extra dollar per buyer lets you pay more for each click.
One exception. A sales page under 1 percent goes first, because too few buyers reach the steps after it. Our guide to upsells that sell the next problem covers the back end.
Rough floors for each step of a small online offer
| Step | Share who move on | Below this, look closer |
|---|---|---|
| Short sales page, buy buttons throughout | 8 to 15% of visitors | 8% |
| Sales video page | 1 to 3% of visitors | 1% |
| Long text sales page | About 1 to 5% of visitors | 1% |
| Checkout page | About 30% of those who reach it | 30% |
| First upsell | 20 to 25% of buyers | 20% |
| First downsell | 10 to 15% | 10% |
| Second upsell | 5 to 10% | 5% |
| Second downsell | 3 to 7% | 3% |
Rough floors for a small online offer: one low-price product, one sales page, offers after the sale. Rules of thumb, not a study.
Example: a 20 percent checkout loses one buyer in three
Buyers from 100 people reaching checkout, at the floor and below it
- Checkout at the 30% floor 30
- Checkout at 20% 20
Worked example: 100 checkout visitors times each rate. The math is ours.
Match the symptom to the step
Once you know which step is low, the shape of the drop tells you why. These are the common patterns.
They see the ad and do not click. The reader thinks "interesting, but not for me." They cannot picture themselves using it, so the ad has the wrong reader or the wrong message.
They click and leave fast. The headline does not pay off what the ad promised. Make the page continue the ad's promise, as in our ad-to-page alignment guide.
They read everything and never reach checkout. They do not believe it will work for them. Usually the price is on the page and the proof is not.
They reach checkout and bounce at once. A checkout under about 5 percent means a big mismatch. Either they clicked just to see the price, or the checkout surprised them.
The downsell sells as well as the upsell. That is pushback on the upsell's price. Show more clearly why the upsell is worth its price, or turn the downsell into a payment plan.
Booked calls do not show. Intent died before the call. Raise what they expect to gain before they can book.
Notice the pattern? Every one of these is a story about intent. The number only tells you where to look.

How much they read, and whether they reach checkout, points to the fix
- Curious skimmers Clicked to see the price. Build intent before the cart.
- Checkout surprise A new price, add-ons or no money-back promise. Fix the checkout.
- Broken promise The headline does not pay off the ad. Match the two.
- No belief Price on the page, proof missing. Add proof near the price.
The Metric Read, as set out in this guide.
Each drop has a usual cause and a first fix
| What you see | Usually | Fix first |
|---|---|---|
| Seen, not clicked | Wrong reader or message | The ad |
| Clicked, left fast | Headline breaks the ad's promise | The headline |
| Read all, no checkout | Price shown, proof missing | Proof |
| Checkout under about 5% | Price peekers or a surprise | The checkout |
| Downsell as strong as upsell | Upsell price pushback | Upsell value or a payment plan |
| Calls booked, no-shows | Intent lost before the call | What they gain by showing |
The Metric Read, as set out in this guide.
Watch where readers stall, and count viewers at the offer
Numbers say where people leave. Recordings show why. Microsoft Clarity is free, records real visits, and shows heatmaps of where people tap and scroll.
Two patterns matter. Lots of taps and long stops on one section means readers do not understand it. They are trying to picture it, so rewrite that section.
Scroll, read, leave means something else. They do not see how it changes things for them, or the words are not their words. Check the story and the opening promise.
On a sales video page, plays are the wrong number. Count how many people who start the video are still watching when the offer appears.
Take 100 people who press play. If 3 are still there at the offer, you can close 3 at most. If 30 are, you can close 30.
The first two to five minutes decide most of it. And if a shorter video says the same things, the shorter one wins. More in our video retention guide.
Example: viewers at the offer cap your sales, not plays
Most sales possible from 100 people who start the video
- 3 still watching at the offer 3
- 30 still watching at the offer 30
Worked example: 100 starters, each viewer at the offer can buy once. The math is ours.
Clean the checkout before you touch the price
The checkout is where people hand you money. Treat it like a cashier, not a billboard.
How to wreck a checkout in four easy steps:
1. Advertise a $5 book, then show an $85 total after seven add-ons.
2. Ask for their name, then their last name, then the name on the card.
3. Add a countdown timer and a pile of 17 bonuses.
4. Label the button "Complete my order," so buyers think they are done and skip the upsell.
That last one is sneaky as hell. The buyer leaves happy. The upsell page never gets seen.
Here is what we do instead. One page, not three, because every extra click is another chance to change their mind.
Ask for email and card. Add an address only if you ship. Put the money-back promise right next to the card box and next to the button, because those are the two moments people pay.
Give them one price decision: "Ebook, $27. Add the audiobook for only $9.95 more." One small number is easier to think about than $27 next to $36.
Name the button for what they get, like "Give me instant access." Skip long bullet lists here, because they restart the selling after the buyer is sold. Keep add-ons short on phones.
Surprise costs are a real reason people quit. Baymard Institute's shopper survey puts extra costs at the top of the reasons for leaving a checkout. Our checkout guide goes deeper.
Fewer fields, one price decision, a button that names the action
| Before | After |
|---|---|
| Three steps to pay | One page |
| Name, last name, card name | Email and card |
| $27 or $36: compare two totals | $27, or add audio for $9.95 more |
| Money-back promise in the footer | Next to the card box and the button |
| "Complete my order" | "Give me instant access" |
| Timer and 17 bonuses | Nothing that distracts |
The Metric Read checkout list, as set out in this guide.
Extra costs drive more checkout quits than a long form
Share of US online shoppers who gave each reason for leaving a checkout
- Extra costs too high 40
- Too long or complicated checkout 17
Baymard Institute, cart abandonment survey of 1,083 US adults, 2026. Read 2026-10-17.
Two fields, one price decision, and the promise where people pay
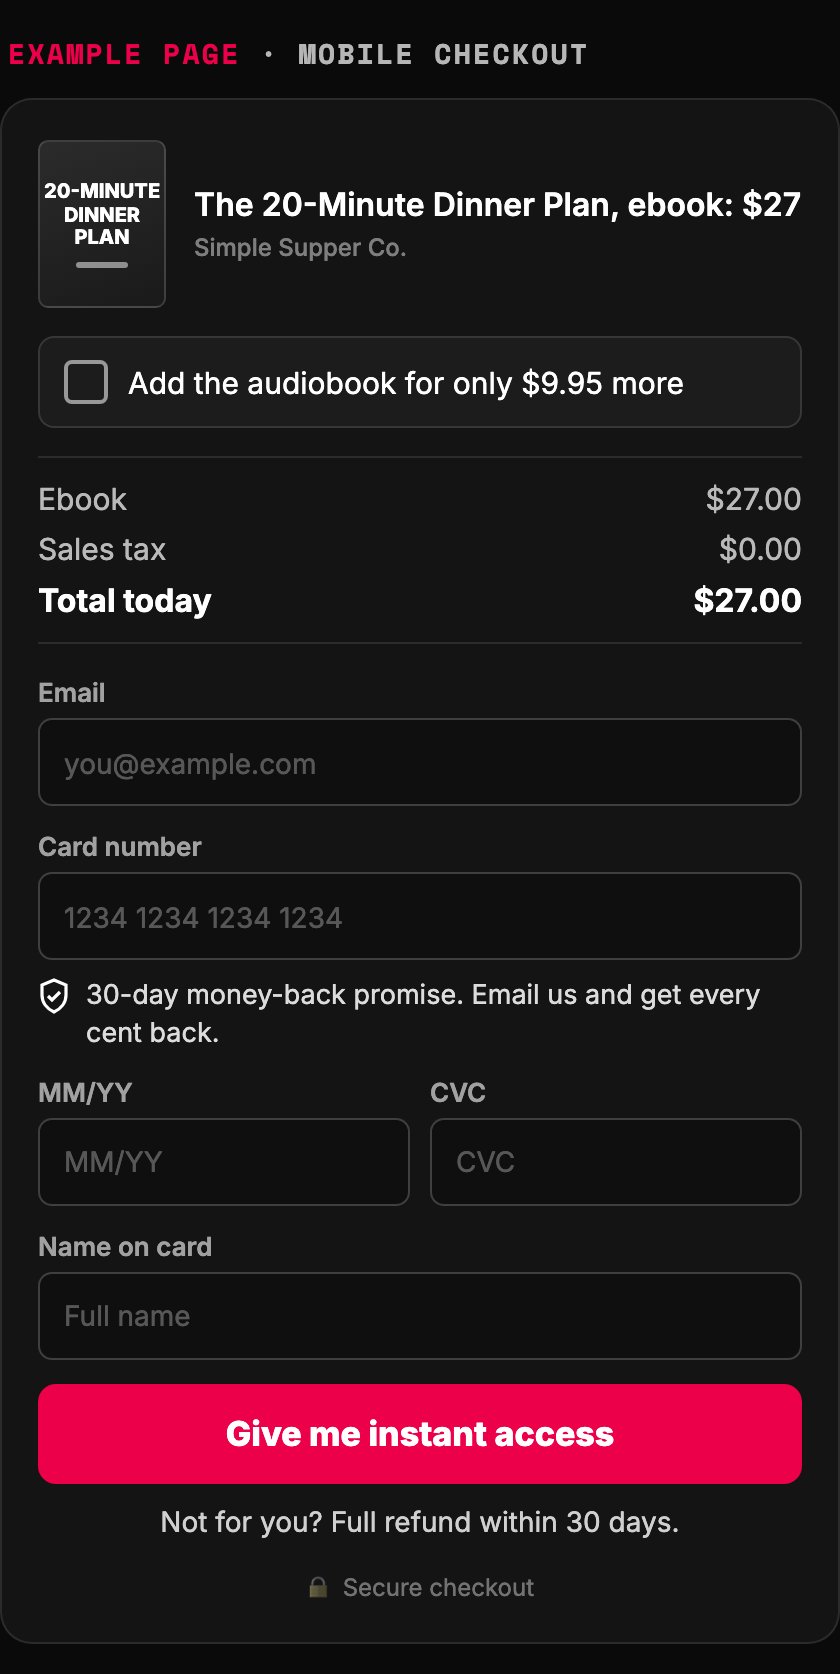
- Two things to fill in: email and card. Ask for an address only if you ship.
- One price decision: $27, or $9.95 more. One small number, not two totals.
- The money-back promise sits where they type the card.
- The button names what they get. Never "Complete my order", or buyers think they are done and skip the upsell.
- Same promise again at the second moment they pay.
Example page built for this article with a made-up brand
Under 1 percent, fix the words before the numbers
There are two kinds of tests. Word tests change who the page speaks to, the promise, the language and the order. Number tests change price, button timing and layout.
Words come first, because they change what every number means. Our rule: a sales page under 1 percent has a words problem. Readers do not get what they want, or they do not believe you.
Between 1 and 3 percent, the words mostly work, but something on the page still pushes readers away. Find it and remove it. Above 3 percent, test the numbers.
For example, one diet book seller split about 8,000 visits between two video pages. One price only: 9 sales, or 0.23 percent. A choice of print or digital: 15 sales, or 0.38 percent.
His next plan was to test the timing of the buy button, which showed up at minute 35. That was the wrong test. Both pages sat far under 1 percent.
His buyers were older and on phones. Holding a phone for 35 minutes is a lot to ask, so most probably never reached the button. The words had to get shorter and faster before any number mattered.
You can test numbers all year when the problem was never a number. Test one thing at a time, as in our one-variable testing guide.
Below 1 percent, rewrite; above 3 percent, test numbers
- Under 1% A words problem. They do not get what they want, or do not believe you.
- 1 to 3% The words mostly work. Find what still pushes readers away.
- Over 3% Now test numbers: price, button timing, layout.
The Metric Read, as set out in this guide.
Example: the better page still sat far under the 1 percent line
Share of visits that bought, about 4,000 visits per page, and the words-problem line
- One price only 0.23
- Print or digital choice 0.38
- Words-problem line 1
Example numbers from another business. Not our results, and not verified by us.
Is your split test dirty? Check who the ad brought
A split test shows two pages to the same kind of traffic. It only proves something when that traffic is fair to both. That is the whole point of A/B testing.
For example, one copywriter wrote a new long page for a client. The client tested it against the old page. The old one won, about 3 percent to 1.
So who came? The ad was written for ready buyers, people who already know what they want. The ad account had learned from those same buyers.
Ready buyers skim. The old page was short blocks with a buy button in every section. The new page was long, with the price once at the bottom.
The new page never got the reader it was written for. Statisticians call this confounding: a third factor that drives the result you thought the page caused.
Before you crown a winner, check one thing. Did the ad and the audience match the reader each page was written for?
Testing for a client? Tell them testing is the right habit, but this test was not fair yet, and show them why.
Then run the new page with an ad written for its reader. To see why ad accounts drift toward ready buyers, read how Meta finds your buyers.
Example: the old page won 3 to 1 on traffic built for it
Share of visitors who bought, when the ad was written for ready buyers
- Old page, short with many buttons 3
- New page, long, price at the bottom 1
Example numbers from another business. Not our results, and not verified by us.
A fair test gives each page the reader it was written for
| Dirty test | Fair test |
|---|---|
| One ad, written for ready buyers | An ad written for each page's reader |
| Ad account trained on skimmers | Audience matched to the page |
| Winner crowned at once | Winner judged after 30 to 50 sales each |
Our comparison, from the Metric Read.
How many sales before you change anything?
Fewer than you think. On a new offer, 10 to 30 sales is enough to start making changes.
At 30 to 50 sales you can make a decision. Judge it by average order value: total sales money divided by buyers.
An early winner can still lose. For example, one seller had a version win the first 250 sales, then lose after that. Near-certain answers take about 1,000 sales, and small offers rarely have that kind of time.
The math behind this is sample size. Small samples give rough answers. Rough and fast beats perfect and late, as long as you change one thing at a time.
Meta has its own clock. It says results are less stable during the learning phase. Learning is about Meta figuring out who to show the ad to, while your sales count is about whether the page works.
Fixing the page is not an edit to the ad set. So fix the page and leave the ad alone.
Check the tracking too. Meta counts a landing page view only when a click actually loads your page. Many link clicks and far fewer page views means a slow page.
10 to 30 sales to start changing things, about 1,000 to be sure
- 10 to 30 sales Enough to start working on a new offer.
- 30 to 50 sales Enough to make a decision, judged by average order value.
- About 250 sales Early leaders can still flip around here.
- About 1,000 sales Near-certain. Most small offers cannot wait that long.
The Metric Read, as set out in this guide. The 250-sale flip is one seller's example.
Run your Metric Read this week
Day one: write down every step and its rate from the last 30 days. Day two: compare each rate with its floor and label each drop curiosity or intent.
Day three: pick one step, fix one thing, and wait for 10 to 30 sales. No sales yet? Start with budgeting a new offer's launch instead.
The prompt below does the reading with you. It asks for your numbers, then names the one step to fix first.
Remember the 2,000 clicks and six sales? That gap is not a mystery. It is one step, waiting to be read.
Your ad account was never quiet. It just talks in rates.
Paste into your preferred AI. It asks for your steps and numbers, then names the one step to fix first and how long to wait.
Act as a funnel analyst. Run a Metric Read on my ad funnel and find the one step to fix first.

Ask me one at a time, with the example:
1. What do you sell, at what price, and what kind of page sells it? (Example: a $27 ebook on a sales video page)
2. List your steps in order. (Example: ad, sales page, checkout, first upsell, downsell)
3. For the last 30 days, how many people reached each step, and how many moved on? (Example: 2,000 page visits, 90 checkout visits, 24 sales)
4. Paste what the ad promises and the page headline.

Rules:
- Turn each step into a rate: people who moved on divided by people who arrived.
- Compare with these rough floors for a small online offer: checkout about 30%; first upsell 20 to 25%; its downsell 10 to 15%; second upsell 5 to 10%; its downsell 3 to 7%; short sales page 8 to 15%; sales video page 1 to 3%; long text page 1 to 5%.
- If I sell a local service or use a booking form, say these floors do not fit and use my own last 30 days instead.
- Label each drop: curiosity (they looked but cannot picture using it) or intent (they wanted it and something stopped them).
- Sales page under 1%: a words problem, fix it first. 1 to 3%: find what makes readers doubt. Over 3%: test numbers.
- Several steps low and the page is over 1%: fix from the back (upsells, then checkout, then the page).
- Check that the page headline pays off the ad's promise.
- Under 10 sales: say the data is too thin to judge and tell me what to watch.
- Never invent a number. If I skip one, ask.
- If you can browse, check Meta's current help pages for landing page views and the learning phase and tell me if anything changed.
- No fake timers, fake scarcity or hidden add-ons in any fix.

Show your math, then answer:
Rates: [step, rate, floor, above or below]
Labels: [step, curiosity or intent, why]
Fix first: [one step, one change, why]
Wait for: [sales count before judging]
Next three actions: 1. 2. 3.
One step flagged, one change, then wait for 10 to 30 sales
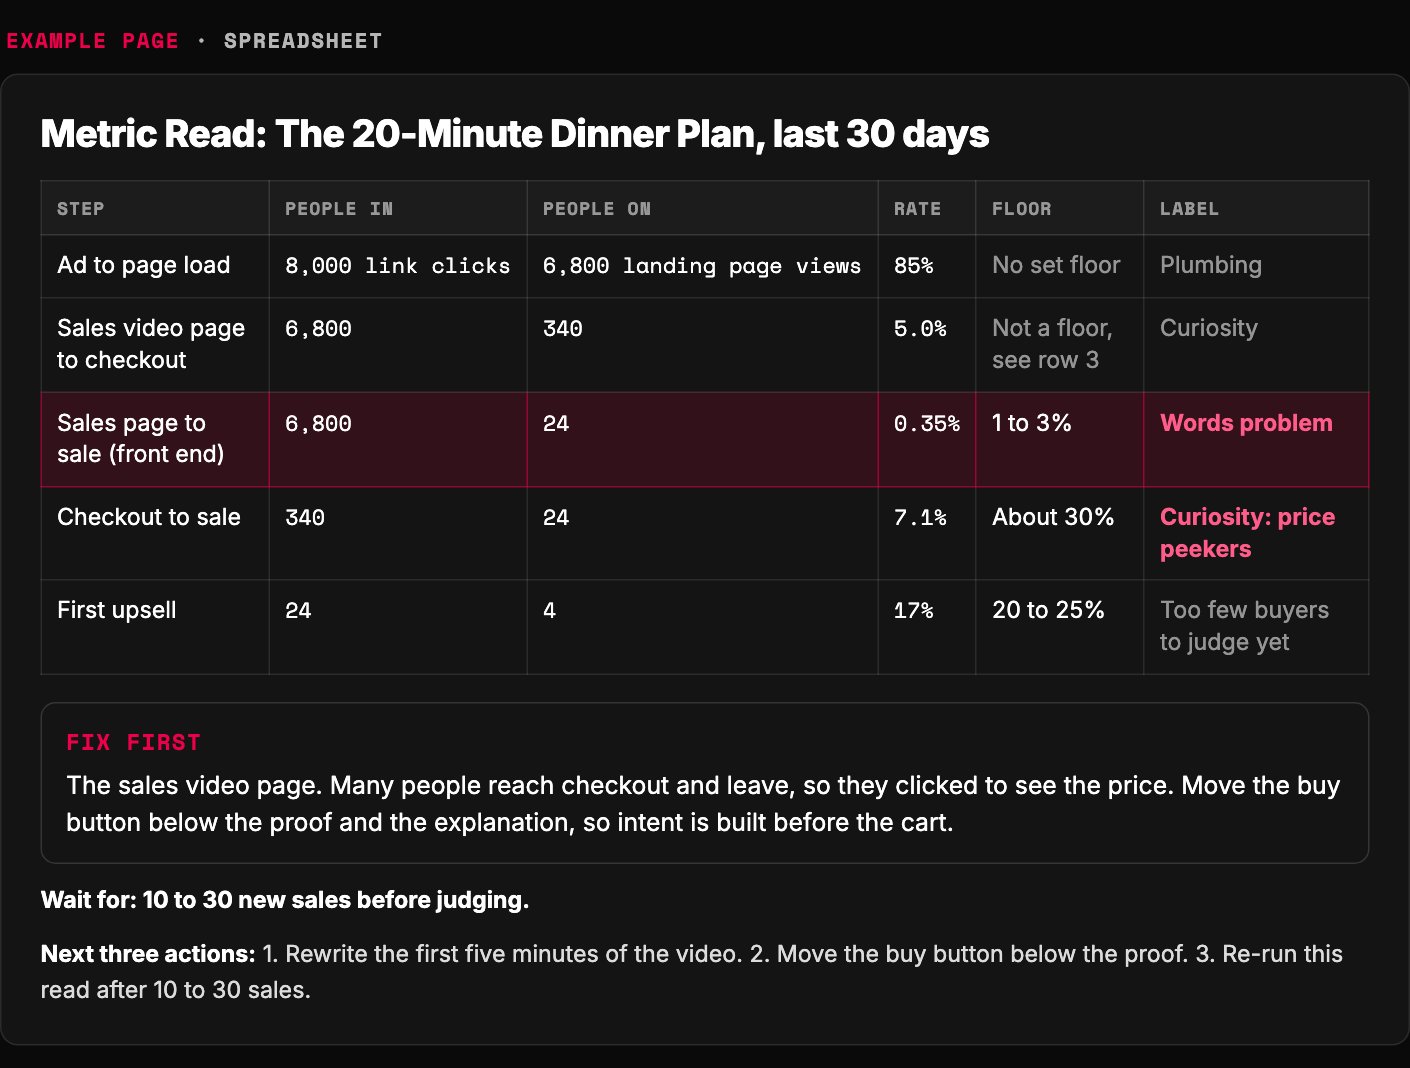
- Under 1 percent is a words problem, so this step goes first.
- Checkout at 7 percent against a 30 percent floor. They came to see the price, not to buy.
- Every drop gets one word: curiosity or intent.
- One step, one change. Everything else waits.
- No new judgment until 10 to 30 more sales.
Example page built for this article with a made-up brand

Filip Kovacevic is the founder of Anar Agency in Phoenix. He spent five years running SEO, Meta ads, email, and content for medical practices across the United States, and now does the same work for healthcare, home-service, legal, and professional-service businesses, alongside AI implementation. More from Filip →
Talk it through in 15 minutes
Bring one question from this article. We will tell you what we would do, whether or not you hire us.
Book a 15-Min Chat →