Google Ads Cost Per Click by Industry, and How to Use the Number

Google Ads cost per click by industry follows what one customer is worth. Restaurants and entertainment pay little per click. Legal and insurance clicks cost the most, since one client is worth thousands.
A click is affordable when it costs less than one customer's profit, times the share of leads who buy, times the share of clicks that become leads.
What does a Google Ads click cost by industry?
A plumber reads a headline. It says the average Google Ads click costs a few dollars.
Then he opens his own account. He pays about ten times that. Is he getting robbed?
No. He is reading the wrong number. Tables of Google Ads CPC by industry are everywhere, and most answer a different question than his.
CPC means cost per click: what you pay each time someone clicks your ad. The useful question is not what other people pay. It is what you can afford to pay.
So here is the rule. A click is worth buying when it costs less than your break-even CPC. A benchmark only tells you the price of entry.
Our take: plenty of benchmark posts come from companies that sell ad management. A scary average is good marketing for them. It is a lousy plan for you.
A published average answers a different question than yours
| What the headline gives you | What you need to plan |
|---|---|
| One average for every business | The price of your own head terms |
| Cheap and costly keywords blended | Head terms and research terms split |
| No link to what a customer is worth | Your break-even CPC |
| A date you have to hunt for | A date on every number |
Anar method
Why the average CPC you read never matches your account
A published average CPC blends every keyword and every advertiser in a category. Your account buys a narrow slice of that. The two numbers measure different things.
Take legal services. The category average mixes clicks from people ready to hire a lawyer with clicks from people just researching a question. Research terms are cheap and common, so they drag the average down.
Head terms are the two or three phrases a buyer types when ready to hire. They cost far more. They also close.
So what does your account show? Your actual CPC, the final amount Google charges for a click. It is often less than your bid, because you pay just enough to beat the ad ranked below yours.
Then there is the planning number. Google's Keyword Planner shows a top-of-page bid range for each keyword. The low end is about the 20th percentile of past bids, and the high end is about the 80th.
That range is a price of entry. It is not a forecast of your bill.
Comparing your head-term CPC to a category average is like comparing your rent to the national average for all buildings. Garages included.
Nothing is broken. You are reading a blend.
Three CPC numbers answer three different questions
| The number | Where it comes from | What it answers |
|---|---|---|
| Actual CPC | Your own account, after each auction | What you really paid per click |
| Top-of-page bid range | Keyword planning data, about the 20th to 80th percentile of past bids | The price of entry for one keyword |
| Category average CPC | A vendor's customer accounts, all keywords blended | Roughly what a whole industry pays |
Google Ads Help: Actual cost-per-click and Use Keyword Planner; vendor benchmark reports
Example: a blended average matches neither price you pay
100 clicks: 20 head-term clicks at $40 and 80 research clicks at $4
- Head-term click 40
- Blended average 11.2
- Research click 4
Example math from the method in this article. Illustrative inputs, not benchmarks. ($800 + $320) / 100 clicks = $11.20
The planning number is a range of past bids, not your price
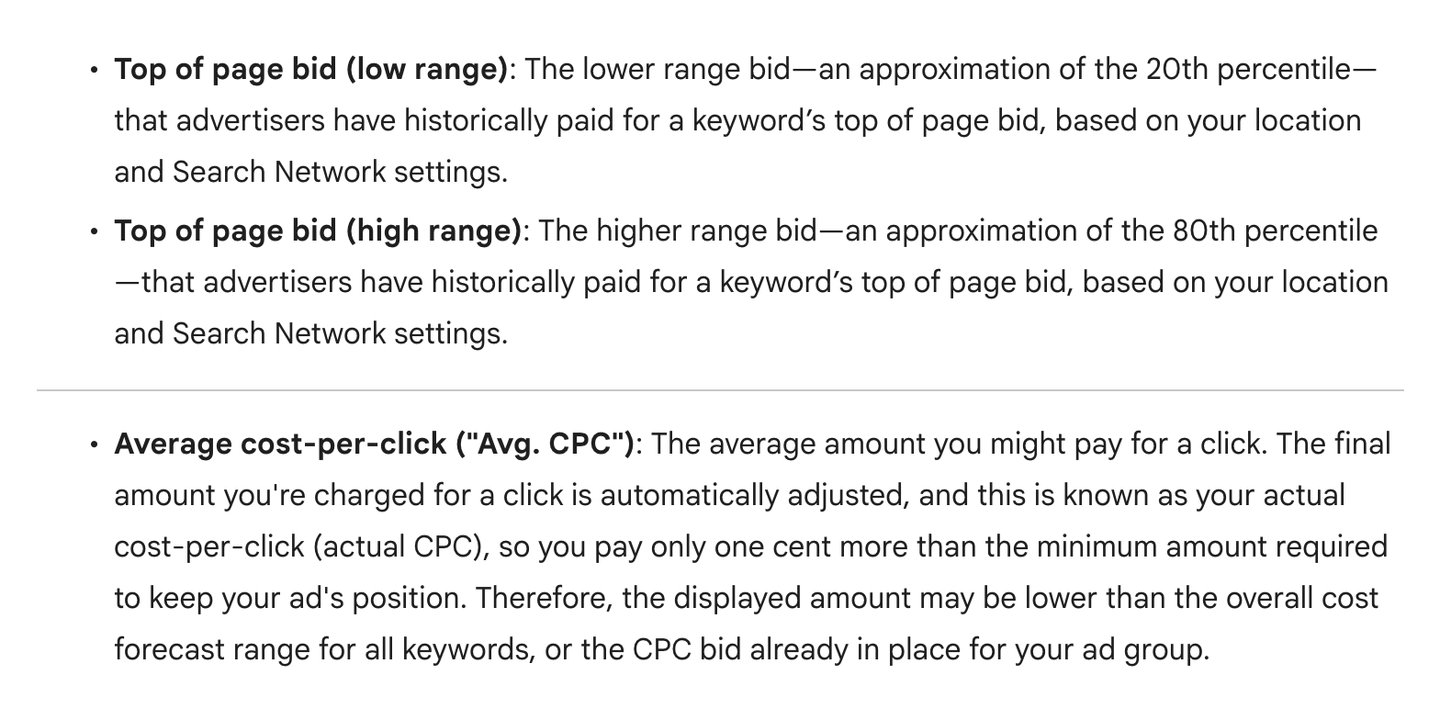
- The low end is about the 20th percentile of past bids. A floor, not a promise.
- The high end is about the 80th percentile. Plan for it, but it is not your bill.
- Set it to your own city first. A national range is a different group of businesses.
- What you really pay shows up later in your account, as actual CPC.
Screenshot of Google Ads Help, About Keyword Planner forecasts (support.google.com/google-ads/answer/3022575), taken 2026-10-18. Two parts of the same page, stacked.
Rank every CPC number before you use it. Rung 1 is your own account over the last 90 days, split by campaign and keyword type. Rung 2 is the bid range for your real head terms in your real market, adjusted for city and season.
Rung 3 is a vendor sample, such as a published category average. Rung 4 is an all-industry average. Plan from rungs 1 and 2.
Read rung 3 for direction. Never put a rung 4 number in a budget. Then judge the number against your break-even CPC: profit per customer, times close rate, times click-to-lead rate.
The Benchmark Ladder: rank every number before you use it
The Benchmark Ladder is our four-rung ranking of CPC numbers, from the one to trust most to the one to trust least. Plan from the top two rungs. Read the bottom two for context.
Rung 1, your own account. The last 90 days, split by campaign and by keyword type. It already holds your offer, your page, your tracking and your city.
Rung 2, your segment's auction. Bid ranges for your real head terms in your real market. This is the right number for a new account with no history.
Rung 3, vendor samples. Ad platforms, agencies and software firms publish averages from their own customers. Big samples, broad categories, mixed tracking.
Rung 4, all-industry averages. One number for every business in the country. Great for a headline, useless for a budget.
Why rank them at all? Each rung down adds more businesses that are nothing like yours. The more strangers in the average, the less it tells you.
Plan from the top two rungs, never from the bottom one
- Rung 4: all-industry average One number for every business. Headline only.
- Rung 3: vendor sample A vendor's customers, broad categories. Read for direction.
- Rung 2: your segment's auction Bid ranges for your head terms in your market. Plan a new account from it.
- Rung 1: your own account Last 90 days, by campaign and keyword type. Wins every time.
Anar method
Each rung down adds businesses that are nothing like yours
| Rung | Use it for | Never use it for |
|---|---|---|
| 1. Your account | Targets and budgets | Nothing; it is the best you have |
| 2. Your segment's auction | A new account's first range | Ignoring your own data once you have it |
| 3. Vendor sample | Checking direction | Setting a target |
| 4. All-industry average | A conversation starter | Any number in a budget |
Anar method
Start from the closest benchmark, then adjust it
The best starting benchmark is the one built from businesses most like yours. Then you adjust it for what you know is different.
Forecasters call that starting group a reference class. The psychologist Daniel Kahneman called it the outside view: begin with how often something happens across similar cases, not with the details of your own.
Douglas Hubbard and Richard Seiersen apply it to risk in How to Measure Anything in Cybersecurity Risk. They give two ways to refine it. Narrow the group to closer peers or recent years, or keep the group and nudge the number for differences you can name.
The same move works in an ad account. That transfer is ours, not theirs.
For example, picture an injury firm in a town of 80,000 people. Its starting number is the bid range for its own head terms, set to its own city. Not a national basket.
Then it adjusts. Fewer rival firms nearby? The Census Bureau's County Business Patterns counts businesses by industry and county, so the firm can check.
Fewer rivals usually means a lower price, because you only pay enough to beat the next ad down. Slow season? Lower the number for those months.
Write the result as a range, low and high. A single number pretends you know more than you do.
After 90 days of your own clicks, the range retires. Your account takes over as rung 1.
Pick the closest group, then adjust for what you know
- Name the search Write the 2 or 3 phrases a ready buyer types.
- Find the closest group Same service, same country, head terms only.
- Set it to your market Pull the bid range for your own city, not the national one.
- Adjust for known differences Rivals in your county, season, keyword match type.
- Write a range Low and high. Retire it after 90 days of your own clicks.
Anar method, adapted from the reference-class idea in How to Measure Anything in Cybersecurity Risk
What is a good cost per click? One below your break-even
A good CPC is any CPC below your break-even CPC. Break-even CPC is the most you can pay for a click before the campaign loses money.
It takes three numbers: what one new customer is worth to you, the share of leads who become customers, and the share of clicks that become leads. Multiply them. That is the whole trick.
Worth means profit from one customer over the time you keep them, not one invoice. That idea has a name: customer lifetime value. Use profit, not revenue, or the math flatters you.
For example, take a plumbing company. One job brings $600 in profit, 60 percent of leads book, and 15 percent of clicks become leads. That is $600 x 0.60 x 0.15, or $54 a click.
The table below runs the same math for an injury firm and a med spa. Compare each result to the head-term figure for your segment in the dated box near the end.
How many clicks buy one customer? Divide one by the click-to-lead rate, then by the lead-to-customer rate. At 5 percent and 20 percent, that is 100 clicks.
Two inputs are yours alone: customer worth and close rate. The third, click-to-lead rate, comes from your account.
No account yet? Run the math at 3 percent and at 8 percent. Plan on the worse one.
Our ad spend calculator runs this for you. For the full ceiling method, see max allowable CPA. If Google should bid toward it, track conversion values, not just counts.
A $50 click is cheap if it pays $54. A $2 click is expensive if it never pays.

Example: three businesses, three break-even CPCs
Break-even CPC = profit per customer x share of leads who buy x share of clicks that become leads
| Business | Profit per customer | Leads who buy | Clicks to leads | Break-even CPC |
|---|---|---|---|---|
| Injury law firm | $15,000 | 20% | 5% | $150 |
| Plumbing company | $600 | 60% | 15% | $54 |
| Med spa | $900 | 40% | 12% | $43 |
Example math from the method in this article. Illustrative inputs, not benchmarks
Example: the same plumber can afford three times more per click by closing more leads
Break-even CPC at $600 profit and 15% click-to-lead, by share of leads who book
- 20% of leads book 18
- 40% of leads book 36
- 60% of leads book 54
Example math from the method in this article. Illustrative inputs, not benchmarks
Example: 1,000 clicks become 10 customers
At 5% of clicks becoming leads and 20% of leads buying
- Clicks 1000
- Leads 50
- Customers 10
Example math from the method in this article. Illustrative inputs, not benchmarks. 1 / (0.05 x 0.20) = 100 clicks per customer
A better page beats a cheaper click
The auction puts a floor under your CPC. Your conversion rate, the share of clicks that become leads, has far more room to move.
In Hacking Growth, Sean Ellis and Morgan Brown tell how LogMeIn's search ads stopped paying back at over $10,000 a month. New ad copy and new keywords did little. Adding a link to buy the paid version on the page tripled conversion.
Fixes to the install and sign-up steps followed. Search ads then scaled by over 700 percent and stayed profitable. Same auction, better page.
The book also passes on simple compounding math from a conversion expert. A 5 percent gain in conversion every month adds up to about 80 percent in a year.
Our math on that: cost per customer falls to about 56 percent of where it started. Can you get a 5 percent cheaper click every month for a year? Not in a real auction.
Google's ad auction rewards the same work. Your position depends on your bid, the quality of your ad and the context of the search, so a relevant ad can win a higher spot at a lower price.
Your Quality Score is Google's 1 to 10 read on how well your ad and page match the search. Start with ad-to-page alignment and the conversion-first audit.
Cheap clicks that never convert are just a slower way to lose money.
Example: a 5 percent monthly conversion gain cuts cost per customer to about 56 percent in a year
Cost per customer, indexed to 100, at the same CPC
- Cost per customer: Month 0 100, Month 3 86.4, Month 6 74.6, Month 9 64.5, Month 12 55.7
Our math on the compounding example in Hacking Growth: 100 / 1.05 to the power of the month
Fix conversion before you hunt for cheaper clicks
- Scale it Cheap clicks that turn into leads. Add budget.
- Fine under break-even Pricey clicks that close. Check the math, then keep them.
- Cheap traffic trap Researchers, not buyers. Check the search terms.
- Fix the page or stop Pricey clicks that go nowhere. Page first.
Anar method
Where people get stuck with CPC benchmarks
Most CPC mistakes come from comparing the wrong two numbers. Three show up again and again.
First, your account looks too expensive. You compared head terms to a blend. Compare them to rung 2 instead, and the shock goes away.
Second, you used a bid range as a forecast. The high end is roughly the 80th percentile of past bids, not your bill. Plan from the range, then let your actual CPC replace it.
Third, you chased the cheapest clicks. Broad, cheap terms bring researchers, not buyers. Check the search terms report to see what people actually typed.
How to set a Google Ads budget from the wrong number in four easy steps. Step one: search for the average CPC. Step two: take the all-industry figure, because it has the biggest font.
Step three: divide your budget by it and promise the boss that many clicks. Step four: act shocked when you get a tenth of them.
That is a hell of a way to learn what a blend is. The table below has all three mistakes, with the fix for each.
For the rest of the numbers in your account, see reading ad data.
Most CPC mistakes compare the wrong two numbers
| Symptom | Cause | Fix |
|---|---|---|
| Your CPC looks far too high | Head terms compared to a blended category average | Compare head terms to rung 2 |
| The bill beats the plan | A bid range used as a forecast | Plan from the range, then switch to actual CPC |
| Cheap clicks, no leads | Broad terms that bring researchers | Read the search terms report and cut them |
Anar method
Current Google Ads CPC benchmarks by industry
The current figures live in the box below, each with its source and date. They will change. The method above will not.
Read every row with the ladder in mind. LocaliQ's search advertising benchmarks and the matching WordStream report are vendor samples, rung 3.
Our head-term baskets come from Keyword Planner bid data. They are rung 2 for the country as a whole, so adjust them for your city.
Notice the gap inside one industry: a category average and a head-term basket can sit more than ten times apart. Both are honest. They just count different keywords.
Conversion benchmarks, like the Unbounce conversion report, are rung 3 too. Every account defines a conversion its own way.
Our full 50-segment table, with search volume and peak month, is on our marketing benchmarks page. We refresh it monthly.
Read the date and the sample before the number
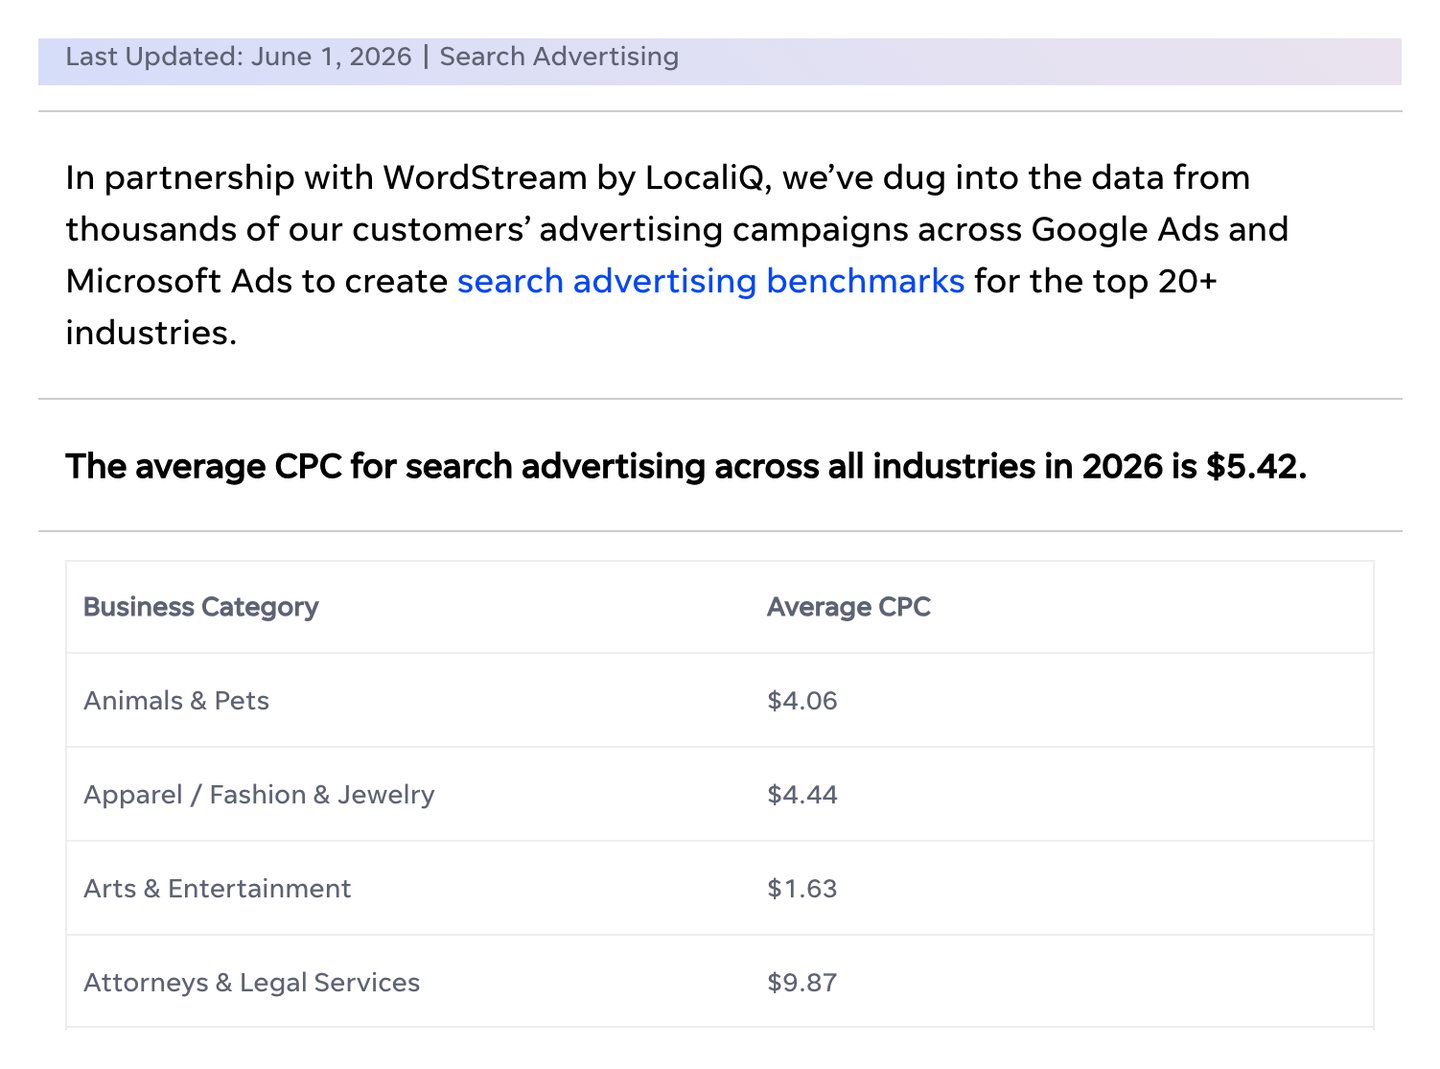
- Check the date first. A benchmark with no date is a rumor.
- The sample is this vendor's own customers, on two ad networks. That makes it rung 3.
- One number for every business. Rung 4: read it, never budget from it.
- A blend of every legal keyword. Head terms like injury or accident cost far more.
Screenshot of LocaliQ, Search Advertising Benchmarks (localiq.com/blog/search-advertising-benchmarks/, page updated June 1, 2026), taken 2026-10-18. Four parts of the same page, stacked.
Run it with AI
The prompt below runs the whole method. Paste it into your preferred AI and answer six questions. It shows its math and returns a break-even CPC, a benchmark range and a verdict.
It never makes up a CPC. If it can browse, it finds a dated source and names it. If not, it asks you.
This week: first, write down your profit per customer and your close rate. Second, run the prompt. Third, compare the result to your actual CPC on your head terms only.
Then size the spend with how much to spend on Google Ads. Want a second pair of eyes? Send us your numbers.
Back to the plumber. His click was never too expensive. He was holding his bill up against a blend.
An average is a weather report for the whole country. You still have to look out your own window.
Paste into your preferred AI. It asks six questions, then gives you a break-even CPC, a ranked benchmark range and a verdict.
Act as a careful paid search analyst. Help me decide if Google Ads clicks are affordable for my business. Use only these rules and my answers. Never invent a number; if one is missing, ask me.
If you can browse, look up a current, dated cost-per-click benchmark for my head terms and country (a keyword planning tool's top-of-page bid range, or a published vendor report). Name the source and its date. If you cannot browse, ask me for it.

Ask one at a time, with the example, and wait:
1. What I sell and where. (Example: emergency plumbing in Tucson)
2. The 2 or 3 phrases a ready buyer types. (Example: plumber near me, emergency plumber)
3. Profit from one new customer over the time I keep them. (Example: $600)
4. Share of leads who become customers. (Example: 60%)
5. Share of clicks that become leads, from my account. (Example: 15%, or I don't know)
6. My actual cost per click on those phrases, last 90 days. (Example: $38, or no account yet)

Rules:
- Break-even CPC = answer 3 x answer 4 x answer 5.
- If answer 5 is unknown, run it at 3% and at 8%, and plan on the lower result.
- Clicks per customer = 1 / (answer 5 x answer 4).
- Rank every CPC number. Rung 1: my own account, last 90 days, head terms only. Rung 2: bid ranges for my head terms in my market. Rung 3: vendor category averages. Rung 4: all-industry averages. Plan only from rungs 1 and 2. Never plan from rung 4.
- Give the benchmark as a low-to-high range, adjusted for my city and season, and say what you adjusted and why.
- Verdict: AFFORDABLE if the expected CPC is under break-even. TIGHT if it is within 20 percent of break-even. NOT YET if it is above. For NOT YET, say how much the click-to-lead rate must rise to fit.

Show your math, then use exactly this format:
BREAK-EVEN CPC:
CLICKS PER CUSTOMER:
BENCHMARK RANGE (source, date, rung):
MY ACTUAL CPC (rung 1):
VERDICT:
WHAT TO FIX FIRST:
NEXT THREE ACTIONS:

Filip Kovacevic is the founder of Anar Agency in Phoenix. He spent five years running SEO, Meta ads, email, and content for medical practices across the United States, and now does the same work for healthcare, home-service, legal, and professional-service businesses, alongside AI implementation. More from Filip →
Talk it through in 15 minutes
Bring one question from this article. We will tell you what we would do, whether or not you hire us.
Book a 15-Min Chat →