Book-a-Call Math: Work Backward From Revenue to Leads

Book-a-call math works backward from your revenue goal. Divide the goal by your deal price to get deals. Divide deals by your close rate to get shows.
Divide shows by your show rate to get booked calls. Divide booked calls by the share of leads who book. Then split it into a daily number.
What are book-a-call funnel metrics? Four rates between a lead and a deal
A founder launched a new offer last week. The goal for next year? Ten million dollars.
Where did that number come from? Usually nowhere. It is a feeling with a dollar sign on it.
A goal you cannot break into a daily number is a wish. This guide turns yours into daily numbers you can check.
If you sell on a call, four rates connect a lead to a deal. These are your book-a-call funnel metrics, the key numbers of your funnel. Each one is simple division.
Lead-to-call rate is booked calls divided by leads. Qualified rate is qualified calls divided by booked calls. Show rate is shows divided by booked calls.
Close rate is deals divided by shows, not by leads or bookings.
Write the four definitions down once. Then every report uses the same math, and the Monday meeting stops being a debate.
Four rates connect a lead to a deal, and each is one division
| Rate | Formula | Common starting target |
|---|---|---|
| Lead-to-call rate | Booked calls / leads | 20% |
| Qualified rate | Qualified calls / booked calls | 50% |
| Show rate | Shows / booked calls | 60% |
| Close rate | Deals / shows | 30% |
Placeholder targets used in the method example; set yours from your market
Work backward: divide your revenue goal down to a daily lead count
Start with two numbers: your yearly revenue goal and the price of one deal. Divide the goal by the price. That gives you deals for the year.
For example, a $1 million year at $2,000 a deal needs 500 deals. That is 42 a month, 10 a week, and about 1.4 a day.
Now walk backward one step at a time. Deals divided by close rate gives shows. Shows divided by show rate gives booked calls.
Booked calls divided by lead-to-call rate gives leads. That is the whole chain.
Run the example at common target rates: 30 percent close, 60 percent show, 20 percent lead-to-call. Then 500 deals need about 1,667 shows.
Those shows need about 2,778 booked calls. Those calls need about 13,889 leads.
Per day, that is about 38 leads. Is that happening right now? You can check it by Friday.
Nobody can picture a million dollars. Anyone can picture 38 leads.
Split every count four ways: year, month, week and day. Divide by 12, by 52 and by 365.
Skip quarters. They add work, and the months already tell you the same thing.
Qualified rate stays out of this chain. Instead, it checks the quality of your bookings. At a 50 percent target, about half your booked calls should be people who can actually buy.
The math also gives you one more number for free. By our math, $1 million across 2,778 booked calls is about $360 of revenue per booked call. To turn that into a spending limit, see max allowable CPA.
Five divisions turn a revenue goal into leads
- 1. Deals Revenue goal / deal price. $1,000,000 / $2,000 = 500 deals.
- 2. Shows Deals / close rate. 500 / 30% = about 1,667 shows.
- 3. Booked calls Shows / show rate. 1,667 / 60% = about 2,778 booked calls.
- 4. Leads Booked calls / lead-to-call rate. 2,778 / 20% = about 13,889 leads.
- 5. Per day Every count / 365. About 38 leads, 7.6 booked calls, 4.6 shows and 1.4 deals a day.
Example, our arithmetic on the method's placeholder targets
Example: a $1 million year at $2,000 a deal starts with about 13,889 leads
Yearly counts at 20% lead-to-call, 60% show and 30% close
- Leads 13889
- Booked calls 2778
- Shows 1667
- Deals 500
Example, our arithmetic
One goal, four rates, and the daily lead count that tells you if the year is on track
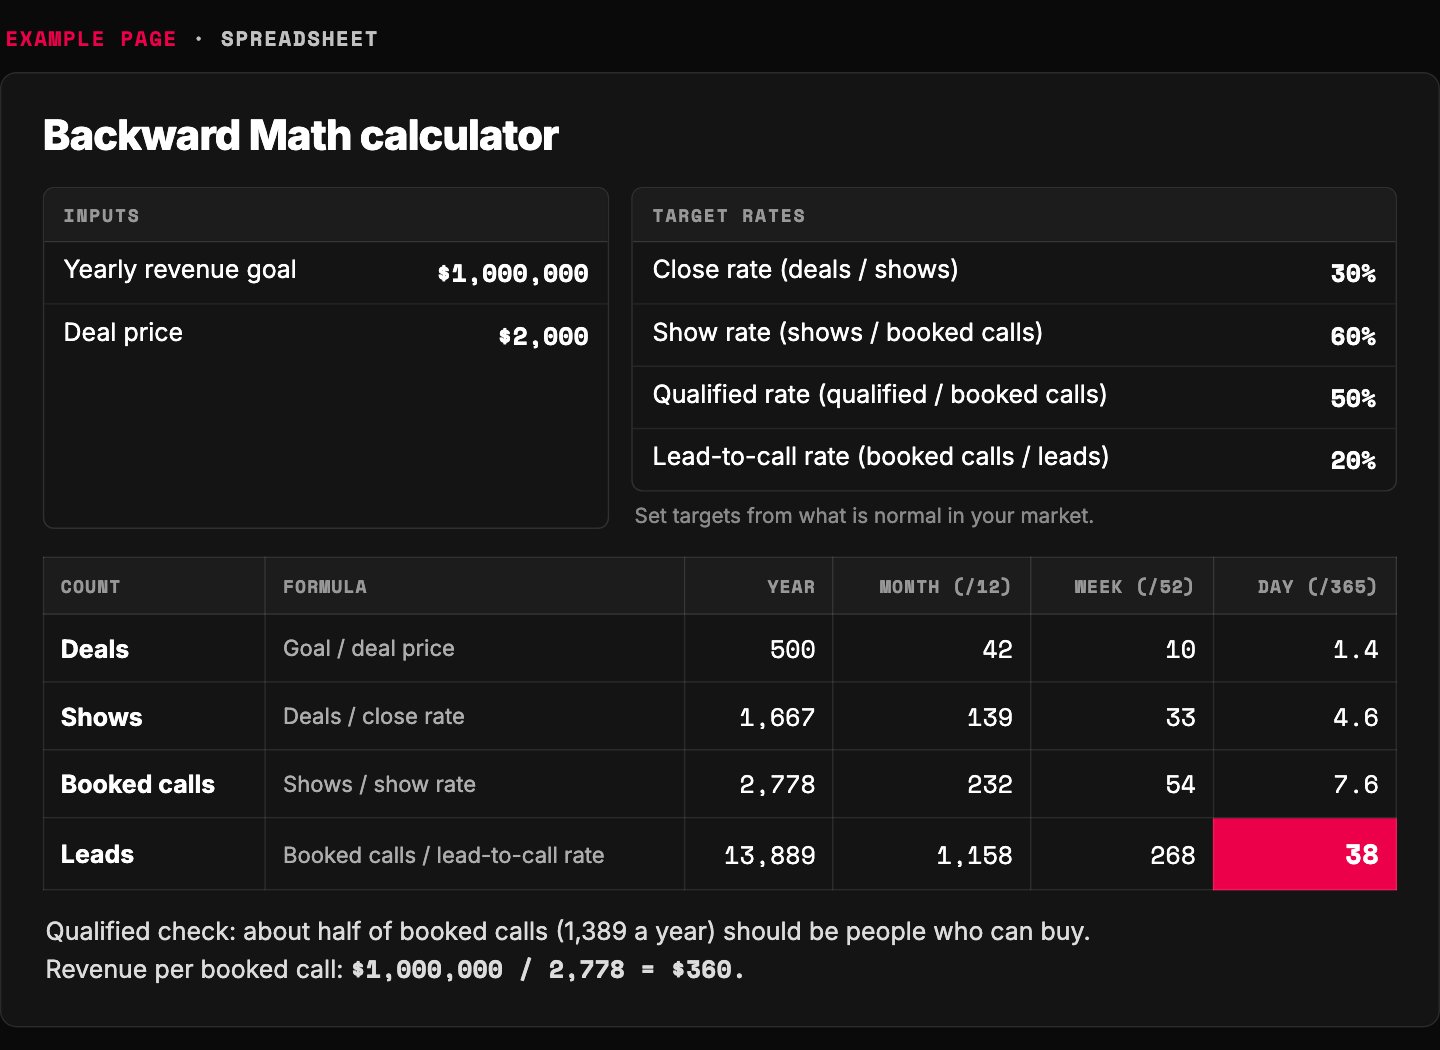
- Start here: your goal and the price of one deal.
- Walk backward one division at a time.
- Show rate is shows divided by booked calls.
- The number to check every day: about 38 leads.
- What one booked call is worth in revenue at these rates.
Example page built for this article with a made-up brand. Numbers are this article's worked example.
Write down four rates with fixed definitions: lead-to-call (booked calls divided by leads), qualified (qualified calls divided by booked calls), show (shows divided by booked calls) and close (deals divided by shows). Take targets from what is normal in your market and the baseline from your own numbers. Divide the yearly revenue goal by the deal price to get deals, then divide back through close, show and lead-to-call rate to get leads.
Split every count by 12, 52 and 365. Each week, read the rates against target, price each gap in deals, and fix the most expensive one first. Its layer, traffic, funnel or sales, names the owner of the fix.
Before blaming sales, check every step above it.
Take targets from your market and the baseline from your own numbers
Each rate needs two numbers. The target is where the rate should be. The baseline is where it is today.
Targets come from what is normal in your market. A solar company and an HVAC company may sell to the same building owners. They still have different prices and different close rates.
No market data? Ask your preferred AI and two people who sell in your market what normal close, show and lead-to-call rates look like. Treat the answer as a starting target, not a fact.
The baseline is your own live data. For example, a business doing $500,000 a year might close 20 percent, show 40 percent and book 20 percent of its leads.
Against the targets above, that business has two gaps. Close rate is 10 points short. Show rate is 20 points short.
Only one week of data? You can still forecast. Multiply the week by 52 for a year and by 4.33 for a month, and divide it by 7 for a day.
For example, $2,000 in one week projects to $104,000 a year. That is about $8,667 a month and $286 a day.
Have three weeks of data? Average them first.
No data at all? Do not model yet. Launch first, spend a few weeks getting real numbers, then come back.
Our guide on how much to spend on a new offer covers that first test.
This is also how you test a big goal. Run the $10 million through the chain. If it asks for ten times more leads than you have ever had, the goal is a wish, not a plan.
Example: a $500,000 business is short on close rate and show rate
| Rate | Baseline today | Target | Gap |
|---|---|---|---|
| Close rate | 20% | 30% | 10 points short |
| Show rate | 40% | 60% | 20 points short |
| Lead-to-call rate | 20% | 20% | On target |
Example baseline from the method; targets are the placeholder rates
Example: one week of $2,000 projects to $104,000 a year
- A year (x 52) 104000
- A month (x 4.33) 8667
- A day (/ 7) 286
Example, our arithmetic on one week of $2,000
Every rate lives in one of three layers: traffic, funnel or sales
A book-a-call business has three layers. Traffic is the ads: spend, clicks, cost per click and leads. Funnel is everything between the lead and the call: pages, booking, emails and texts.
Sales is the call and the close. That is the whole list: three layers.
Each layer has an owner. Traffic belongs to whoever runs the ads, writes them and edits the videos. Funnel belongs to whoever runs page tests and writes the follow-up.
Sales belongs to the sales team, including the follow-up that gets people onto the call.
When a number is off, its layer tells you who to talk to. One conversation, not a blame tour.
Here is the rule that saves the most money. A problem usually starts one step before the place it shows up.
A weak close rate looks like a sales problem. Most of the time, it started earlier.
The layer a number sits in tells you who owns the fix
| Layer | Numbers it holds | Who owns the fix |
|---|---|---|
| Traffic | Spend, clicks, cost per click, leads | Whoever runs, writes and edits the ads |
| Funnel | Lead-to-call, qualified and show rates | Whoever runs page tests and writes the follow-up |
| Sales | Close rate, by rep | The sales team |
Our method
Fix the gap that costs the most deals, not the one that annoys you
For example, take one week from a scorecard. It had 410 leads, 50 booked calls, 31 shows and 9 deals.
Run the four rates. Lead-to-call is 12 percent against a 20 percent target.
Show rate is 62 percent against 60. Close rate is 29 percent against 30.
Which one do you fix? Close rate is one point off. Leave it alone this week.
Lead-to-call is eight points off. That is the urgent one, the bottleneck.
Now put a price on it. At 20 percent, those 410 leads would have booked 82 calls, not 50.
By our math, 32 more calls at the same show and close rates is about 6 more deals a week. The one-point close-rate gap is worth about a third of one deal.
The leads stay the same. You get six more deals.
Our rule: price every gap in deals per week, then fix the most expensive one first. Feelings pick the loudest problem. Math picks the expensive one.
Example week: most leads never booked a call
410 leads, 50 booked calls, 31 shows, 9 deals
- Leads 410
- Booked calls 50
- Shows 31
- Deals 9
Example numbers from one book-a-call business. Not our results; we have not seen the account
Fixing lead-to-call was worth about 6 deals a week; close rate, a third of one
Extra deals a week if only that rate hit its target
- Lead-to-call to 20% 5.8
- Close rate to 30% 0.3
- Show rate (above target) 0
Example numbers from one book-a-call business. Not our results; we have not seen the account. Gap pricing is our arithmetic
A low lead-to-call rate means the next step is failing
A low lead-to-call rate says one thing. People became leads, but the next step did not pull them onto a call.
Either the lead magnet fell flat, or the way you described the call did. A lead magnet is the free thing someone signs up to get.
A high lead-to-call rate means people want the call and your message matches what they came for. Leave that alone.
So where do you look first? The follow-up. That is every email and text sent between sign-up and booking.
List each message with its numbers: opens, clicks and bookings. Find the single weakest one. For example, the second email had the lowest numbers of the week.
Fix that one message, not the whole flow and not the ads.
Then read next week's rate. Our guides to lead nurture sequences and speed to lead cover what good follow-up emails look like.
Fix a low lead-to-call rate one message at a time
- 1. Confirm the gap Lead-to-call well below target, other rates near target.
- 2. Read the meaning Low means the lead magnet or the way you describe the call is not pulling people forward.
- 3. List the follow-up Every email and text between sign-up and booking.
- 4. Rank by numbers Opens, clicks and bookings for each message.
- 5. Fix the weakest one One message. Then read next week's rate.
Our method
Low lead-to-call means fix the next step; high means leave it alone
| Low lead-to-call rate | High lead-to-call rate |
|---|---|
| The lead magnet or the way you describe the call is failing | People want the call |
| Look at the follow-up emails and texts first | The message matches what they came for |
| Fix the weakest message | Spend your time on another rate |
Our method
Before you blame sales, check every step above it
Close rate below target? First, break it out by rep.
For example, one team's target was 30 percent. Rep A closed 24 percent, Rep B 22 and Rep C 26.
Rep B says the leads are bad. Maybe. Check the scorecard before you agree.
Are leads on track? Are booked calls, qualified calls and shows on track? If all four are, it is a closing problem, and the excuse is gone.
Now pick one of three moves. Send more qualified calls to your best closer. Or have your best closer show the team what works.
Or coach the lowest closer one on one. Start with two questions: which objections keep coming up, and what happens on the call?
One warning. Improving only your best closer barely moves the team number, because the other reps pull the average back down.
Good sales management starts with this check. It also helps to qualify people before the call, so closers spend time on people who can buy.
Every rep closed below the 30% target, so check the steps above first
Close rate by rep, one week
- Rep A 24
- Rep B 22
- Rep C 26
- Team target 30
Example numbers from one book-a-call business. Not our results; we have not seen the account
One more deal per rep each week can close a big gap
With small numbers, close rate moves fast. For example, picture a team with about 31 shows a week and 6 deals. That is 19 percent against a 30 percent target.
It looks like a crisis. The gap is only three deals.
Nine deals from the same 31 shows is 29 percent. Ten deals is 32 percent.
The team has three reps, so three extra deals means one more deal per rep per week.
Where do those deals come from? Usually the pipeline: people who already talked to you and have not decided yet. Ask each rep how many are sitting there, and how well each one was followed up.
You do not need a dramatic lift. You need a small weekly target with a name next to it.
Example: three more deals a week takes close rate from 19% to 29%
Close rate from about 31 shows a week
- 6 deals 19
- 8 deals 26
- 9 deals 29
- 10 deals 32
Example numbers from one book-a-call business. Not our results; we have not seen the account. Rounded to whole percents
Run one scorecard every week: this week, last week, target, on track
Everything above fits on one weekly scorecard, a simple dashboard. The rows are spend, clicks, cost per click, leads, booked calls, qualified calls, shows, deals and revenue, plus the four rates.
The columns are this week, last week, the change in percent, the target, and on track or off track. Green or red.
The last-week column tells you if a change worked. For example, cost per click fell from $2.00 to $1.91, about 5 percent.
If you changed the ads, ask what changed. Which angle did it? Can you repeat it?
Judge the week, not a single day. One bad day inside a normal week is usually noise.
Running ads on several channels? Read the combined total for all channels first. Then split it by channel and find the one falling behind, as in our guide to reading ad data.
How to run a sales team on vibes in four easy steps. Step one: pick a goal from a feeling. Step two: never write down the rates.
Step three: when deals drop, blame the closers. Step four: buy more ads to fix a problem that lives in the second email.
That is a hell of a way to spend a year. A weekly scorecard ends it.

One table, five columns, every number that matters
| Row | This week | Last week | Change | Target | On track? |
|---|---|---|---|---|---|
| Cost per click | $1.91 | $2.00 | -5% | Your limit | Green or red |
| Leads | From the chain | ||||
| Lead-to-call rate | 20% | ||||
| Show rate | 60% | ||||
| Close rate | 30% | ||||
| Deals | From the chain |
Our layout. Cost per click row is example data; targets are the placeholder rates
The red cell picks this week's fix: lead-to-call, not the closers
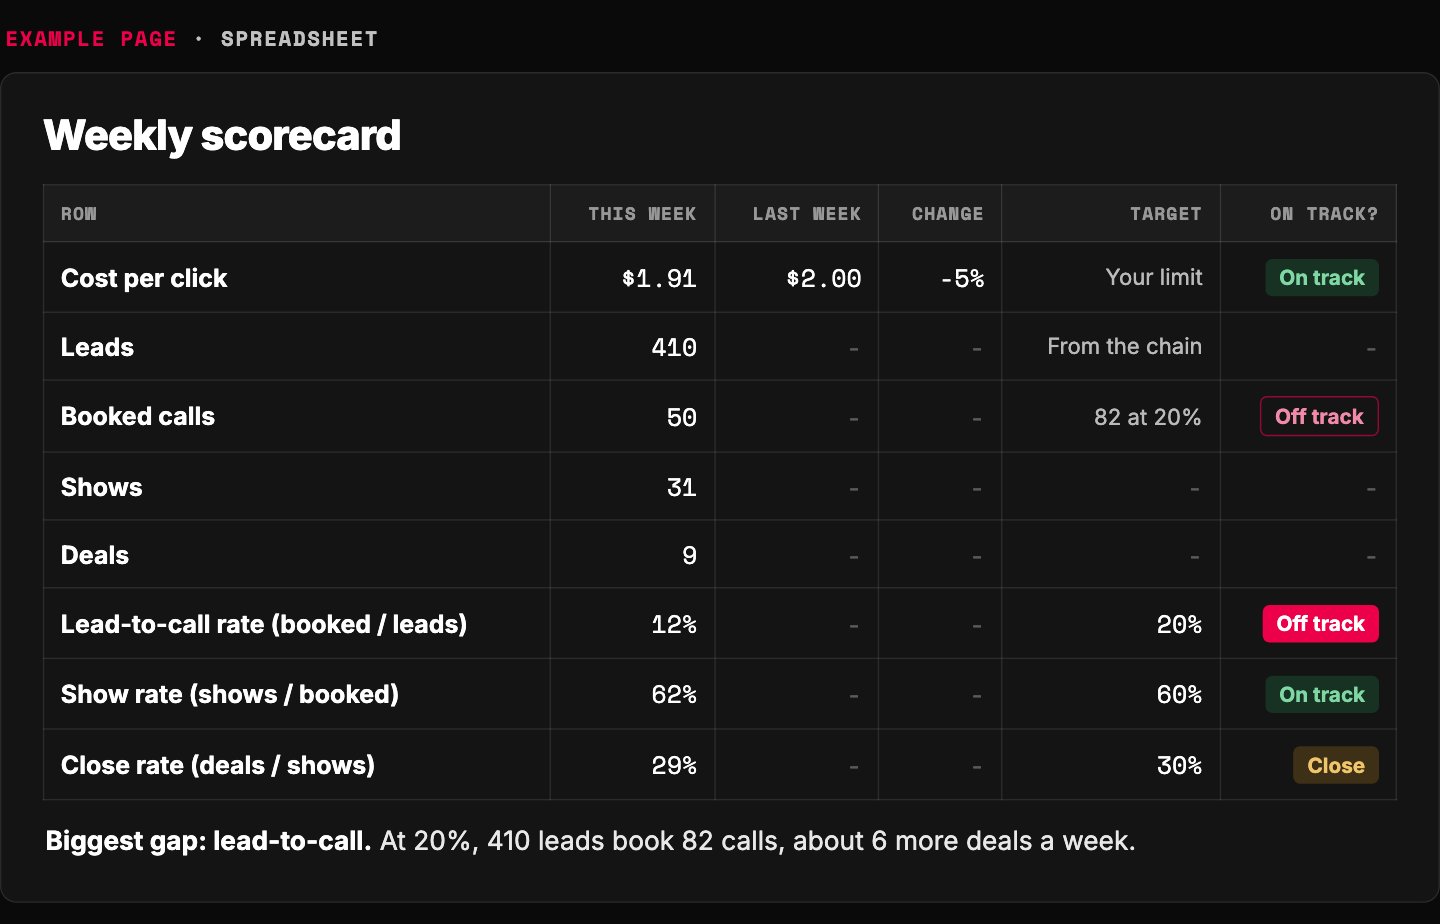
- Last week next to this week shows if your change worked.
- Cost per click fell from $2.00 to $1.91, about 5 percent.
- Eight points under target. This is the fix this week.
- One point off. Leave it alone this week.
- Price each gap in deals, then fix the most expensive one.
Example page built for this article with a made-up brand. Numbers are this article's worked example.
Build your Backward Math sheet with AI
The prompt below runs the whole method. Paste it into your preferred AI and answer its questions with your real numbers.
It asks before it guesses. It returns your daily targets, your rates against target, the gap that costs the most deals and who owns the fix.
This week: first, write down the four rate definitions. Second, run the prompt with last week's numbers. Third, fix the one gap that costs the most deals, then check it on next week's scorecard.
Want a second pair of eyes on your numbers? Send them to us; you are not signing up for anything.
Back to the founder with the $10 million goal. Run it through the chain, and the answer comes out in leads per day.
Either those leads exist or they do not. The goal sits at the top, but the work happens at the bottom, one lead at a time.
Paste into your preferred AI. It asks for your numbers, then returns daily targets, your rates against target, the most costly gap and its owner.
Act as a careful sales analyst building my Backward Math sheet for a business that sells on a call. Use only these rules and my answers. Never invent a number; if one is missing, ask me.

Ask one at a time, with the example, and wait:
1. My yearly revenue goal. (Example: $1,000,000)
2. The average price of one deal. (Example: $2,000)
3. Target rates for my market: close rate, show rate, qualified rate, lead-to-call rate. If I do not know them, tell me to ask two people who sell in my market, and use 30%, 60%, 50% and 20% as placeholders until I do.
4. Last week's numbers: leads, booked calls, qualified calls, shows, deals, ad spend, cost per click. If I have several weeks, average them. (Example: 410 leads, 50 booked, 31 shows, 9 deals)
5. The same numbers for the week before, if I have them.
6. Last week's close rate for each sales rep. (Example: A 24%, B 22%, C 26%)

Rules:
- Close rate = deals / shows. Show rate = shows / booked calls. Qualified rate = qualified calls / booked calls. Lead-to-call rate = booked calls / leads.
- Deals needed = goal / deal price. Shows needed = deals / target close rate. Booked calls needed = shows / target show rate. Leads needed = booked calls / target lead-to-call rate.
- Qualified rate is a check, not a step: compare it to its target and report it.
- Split every count by 12 for a month, 52 for a week and 365 for a day. Round month and week counts up.
- Revenue per booked call = goal / booked calls needed.
- If leads needed per day are far above anything in my numbers, say plainly that the goal does not fit my numbers yet.
- For each rate: last week, target, on track or off track, and the change from the week before.
- Price each gap in deals per week: keep the other rates at last week's levels and work out how many more deals I would close if only that rate hit its target. Rank the gaps, biggest first.
- Layers: lead count and cost per click = traffic (the ads). Lead-to-call, qualified and show rates = funnel (pages, booking, follow-up emails and texts). Close rate = sales.
- If close rate is the top gap, first check that leads, booked calls, qualified calls and shows are on track. If any is off, say the cause is likely upstream.
- If close rate is off, show each rep against target and how many extra deals a week reach target, split across the reps.
- If lead-to-call rate is the top gap, tell me to list every follow-up email and text with its numbers and fix the weakest one first.

Show your math, then use exactly this format:
TARGETS (deals, shows, booked calls, leads; year / month / week / day):
REVENUE PER BOOKED CALL:
RATES VS TARGET:
BIGGEST GAP (in deals per week):
LAYER AND OWNER:
ONE FIX THIS WEEK:
CHECK NEXT WEEK: the one number that should move.

Filip Kovacevic is the founder of Anar Agency in Phoenix. He spent five years running SEO, Meta ads, email, and content for medical practices across the United States, and now does the same work for healthcare, home-service, legal, and professional-service businesses, alongside AI implementation. More from Filip →
Talk it through in 15 minutes
Bring one question from this article. We will tell you what we would do, whether or not you hire us.
Book a 15-Min Chat →