Max Allowable CPA: The Ceiling That Tells You Which Ads to Kill

Max allowable CPA is the most you can pay to win one customer and still be glad you did. Take what one order earns after product, shipping and fees. Decide how much of that you will spend to get a customer.
That number is your ceiling. Any ad that costs more gets fixed or cut.
What is max allowable CPA? The number that ends the guessing
Monday ad meeting. Someone reads a number off the screen: cost per sale, $46.
Then the room goes quiet. Is $46 good? Nobody knows, so everyone guesses.
The loudest guess wins. That is a vote, not a review.
The fix is one number, written down before the meeting: your max allowable CPA. CPA means cost per acquisition, the ad cost of winning one customer. Your max allowable CPA is the most you can pay for one and still be glad.
With that number on the sheet, $46 stops being a mystery. Under that number, you keep going. Over it, you fix or cut.
Most ad reports never show this line. Platforms get paid when you spend, not when you profit. Our take: nobody else will write your ceiling for you.
Two example businesses show how it works. One sells a subscription supplement. The other sells courses and coaching.
Their numbers are examples, not our results. We have not seen their accounts.
Six lines turn one cost per sale into a clear keep-or-cut call
- 1. Profit per order Price minus product, shipping, packing and card fees.
- 2. Your ceiling The share of that profit, or months of a subscription, you will spend to win one customer.
- 3. Max cost per click Ceiling x the share of clicks that end in a sale.
- 4. Channel check Earnings per click next to cost per click, one row per channel.
- 5. Product check Each product line gets its own ceiling and its own cost per customer.
- 6. Weekly kill rule Above the ceiling for 7 days: fix or cut. Under it: report how much spend is left.
Our method
Work out your ceiling from what one order earns
Start with what one order earns after it ships. That is your gross profit: the price minus product, shipping, packing and card fees.
Then make one choice. How much of that profit will you hand to the ads to win the customer? That part is a decision, not math.
For example, take the supplement brand's sheet. It sold a $47 starter product at about 50 percent gross profit. Using its average order, the sheet showed about $26 of profit per sale.
For a one-time sale with no repeat, $26 is your break-even point. Pay more and every sale loses money. Pay less and you keep the difference.
Subscriptions change the choice. The same brand accepted losing two months of revenue to win a subscriber. Its ceiling was $118.
Two months of its $59.22 subscription order comes to $118.44. We did that math ourselves. The sheet did not show it.
Sell a service or buy leads? Same idea. For example, picture a $400 job that costs $160 to deliver, which leaves $240.
Spend half of it to win the customer and your ceiling is $120. If one lead in four buys, a lead can cost $30. Our guide to book-a-call math runs the same back-solve for sales calls.
Without a ceiling, you cannot judge an ad.
Same rule, three businesses: profit per order sets the ceiling
Profit per order times the share you choose to spend
| Business | Profit per order | Your choice | Ceiling |
|---|---|---|---|
| Supplement, one-time product | about $26 | Spend all of it (break-even) | $26 |
| Supplement subscription | $59.22 order | Lose two months of revenue | $118 |
| Service, $400 job (example) | $240 | Spend half | $120 a customer |
| Same service, 1 lead in 4 buys (example) | $120 a customer | x 25 percent | $30 a lead |
Rows 1 and 2: Example numbers from one subscription supplement brand. Not our results; we have not seen the account. Row 2's two-month match is our arithmetic; rows 3 and 4 are our example
Line one: what one order earns after product, shipping and fees. Line two: the share of that profit, or the months of a subscription, you will spend to win one customer. That is your ceiling, your max allowable CPA.
Line three: max cost per click equals the ceiling times the share of clicks that buy. Line four: earnings per click for each channel, next to its cost per click. Line five: a ceiling and a cost per customer for each product line.
Line six: every week, anything above its ceiling gets fixed or cut, and any spend left under it gets reported. Repeat business counts only when your records show it. Re-run the sheet every month.
Turn the ceiling into a max cost per click
Sales come in slowly. Clicks come in fast. So build a second limit you can check on day one.
Max cost per click = your ceiling x your conversion rate. Conversion rate is the share of clicks that end in a sale.
For example, say you make $26 of profit per sale and 5 percent of clicks buy. Then a click can cost up to $1.30. Pay more than that and you lose money before anyone reaches checkout.
The supplement sheet ran this exact math. Its max came to about $1.31 a click. Its real cost per click, Google and Meta blended, was about $1.64.
Crisis? Not yet. But a gap like that warns you, days before sales numbers do, that something between the click and the sale is off.
Think of these limits as bumpers, like the rails in a bowling lane. Set your sheet to turn a cell red once a click costs more than it earns. For example, the coaching business had one offer at $15 a click, and at that price it could not work.
Plan for clicks to get pricier as you grow. For example, the coaching business paid about $2.35 a click at $500 a day and expected a much higher price at $5,000 a day. So raise the cost per click in your plan before you scale.
To run the same math on your landing page, see earnings per session.
Example: at $26 a sale, the click limit rises with the share of clicks that buy
Max cost per click = $26 profit per sale x conversion rate
- 1% of clicks buy 0.26
- 2% of clicks buy 0.52
- 5% of clicks buy 1.3
- 10% of clicks buy 2.6
Example math from the $26 profit per sale on the supplement sheet
Example: clicks cost about 25 percent more than the limit
Max cost per click vs real blended cost per click, Google and Meta
- Max cost per click 1.31
- Real blended cost per click 1.64
Example numbers from one subscription supplement brand. Not our results; we have not seen the account. Treat the figures as approximate
Compare channels by earnings per click, then move the money
Earnings per click is revenue divided by clicks. Work it out for each channel, not just the total.
Here is why. On an older version of the supplement sheet, Google earned $2.46 per click. Meta earned $0.27.
On that same data, Meta brought back 35 cents for every ad dollar, a return of 0.35. Google had room for more budget. Meta needed a fix or a cut.
Our rule: if a channel earns more per click than the click costs, test more budget there. If it earns less, fix the ad or the page before you add a dollar.
A blended number averages a winner and a loser into one number that looks fine. That fine-looking average can hide a channel that loses money every single day.
Next, find which step breaks inside the weak channel. Reading ad data shows how.
Google earned nine times more per click than Meta
Earnings per click = revenue / clicks, by channel
- Google 2.46
- Meta 0.27
Example numbers from one subscription supplement brand. Not our results; we have not seen the account
Two numbers per channel tell you to scale, fix or cut
- Scale Test more budget here, in steps.
- Fix the profit Sales cover the ads but not the costs. Work on order value or margin.
- Loss you chose Fine only if measured repeat orders pay it back.
- Cut or fix now Every click and every customer costs too much.
Our rule, built on the earnings-per-click and ceiling lines above
Cut ads above the ceiling, and report the room left below it
The supplement sheet's rule was blunt. Any ad that won customers above the $118 ceiling got killed. No meeting, no debate.
Kill does not have to mean delete. Pause it, fix the ad or the page, and relaunch it as a new test.
Should one bad day kill an ad? No. Google's Target CPA and Meta's cost per result goal both aim at an average, and Meta tells advertisers to judge weekly averages, not single days.
So our rule runs weekly. If an ad's cost per customer over the last 7 days sits above the ceiling, it goes. If you type a target into the platform, set it below the ceiling, because some sales will cost more than the average.
The ceiling works in the other direction too. On a newer weekly sheet, the ceiling was $92 and new customers cost $46. That let the brand's ad team say it in plain words: we may spend up to $92 a customer, and we are paying half.
That turns a budget talk into plain math. The coaching business built a forecast the same way, from about 20 sales a day up to a $100,000 month. Its ceiling set how much ad spend that plan could use.
The two supplement sheets used different ceilings, $118 and $92, and we do not know why. That is normal. A ceiling moves when your prices, costs or repeat numbers move.
To size a whole budget from a ceiling, see sizing a Google Ads budget. The box below lists the platform settings this touches.
Allowed to pay $92 a customer, paying $46: half the room unused
Ceiling vs real blended cost per new customer
- Ceiling (max allowable CPA) 92
- Real cost per customer 46
Example numbers from one subscription supplement brand. Not our results; we have not seen the account
Meta's cost goal aims at a weekly average, so the kill line stays in your sheet
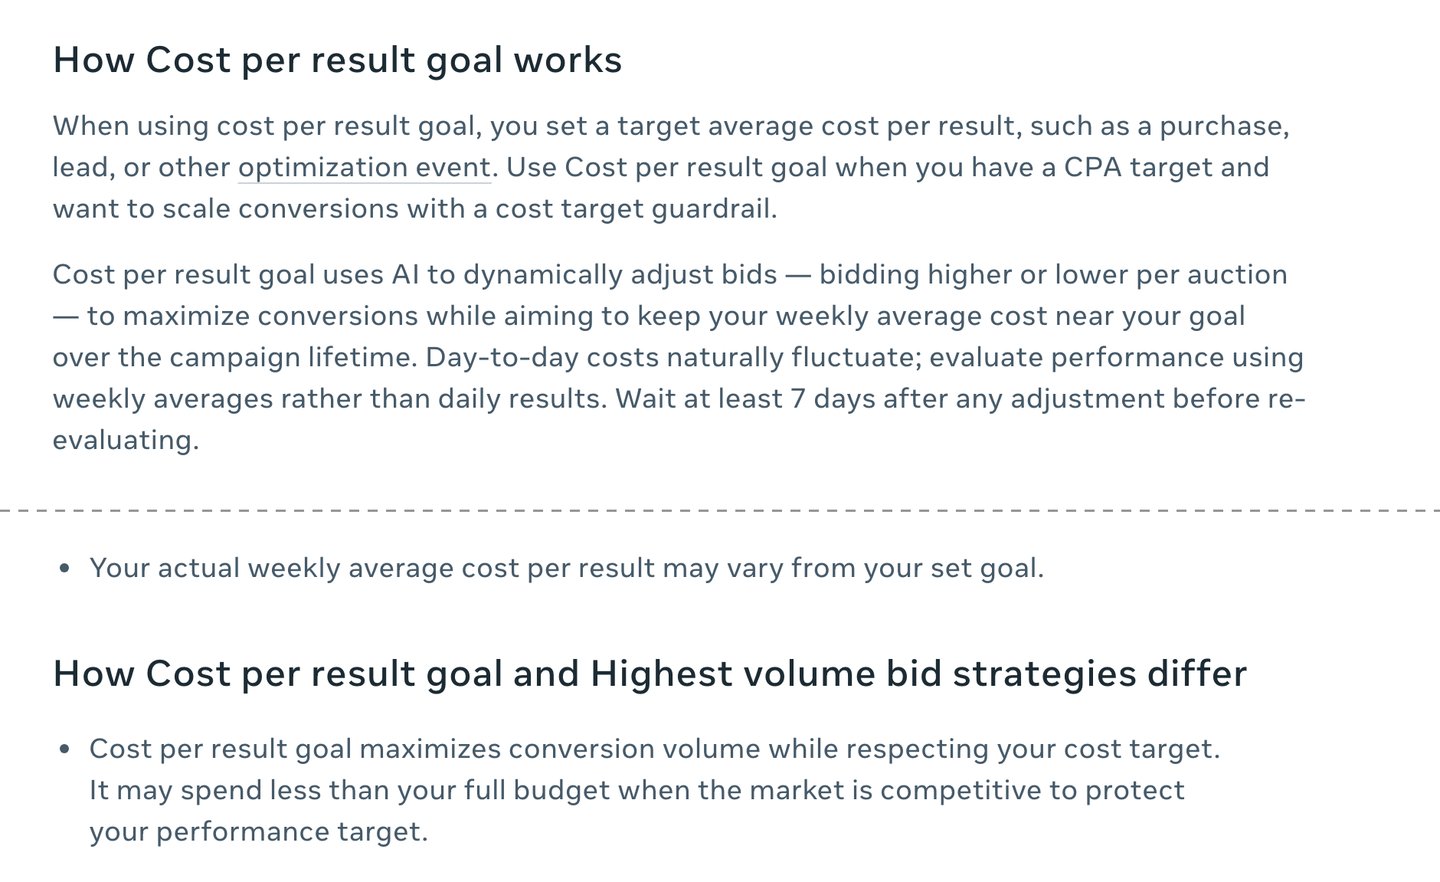
- You type a target average, not a hard limit. Some sales will cost more.
- Meta aims at the weekly average, so one bad day is not a verdict.
- Meta's own advice: judge weekly. Our kill rule uses the last 7 days too.
- Even the weekly average can miss the goal. So set any target below your ceiling.
- With a cost goal set, Meta may spend less than your full budget.
Screenshot of Meta Business Help Center, About cost per result goal, taken 2026-10-17. Two parts of the page, joined at the dashed line
Split the sheet by product line, because one blended number hides a loser
The supplement brand ran regular campaigns and a subscription campaign side by side. Overall, new customers came in under the ceiling.
Then the sheet filtered for subscriptions only. It showed 51 subscriptions, 31 of them new, at $130 each. The ceiling was $118.
So the total looked healthy while one product line lost money on every new subscriber. The blended number hid it. The fix was to isolate the subscription campaign and work on it with the team.
Give each product line its own row: its own profit, its own ceiling, its own cost per customer. One-time buyers and subscribers are different customers, so they get different ceilings.
One product line, one ceiling.
The total looked fine while subscriptions ran $12 over the ceiling
Same ad account, filtered two ways
| View | Cost per new customer | Ceiling | Call |
|---|---|---|---|
| All new customers | Under the ceiling | $118 | Keep |
| Subscriptions only (51, 31 new) | $130 | $118 | Isolate and fix |
Example numbers from one subscription supplement brand. Not our results; we have not seen the account. The all-customer figure was not given, only that it was under the ceiling
Count repeat customers only from your records
Repeat buyers raise what a customer is worth. That is customer lifetime value: the money one customer brings in over their whole time with you.
The napkin version is fast: total revenue divided by total customers. For example, the coaching business worked it out in seconds at $724.26 a customer. Its data team, after about a month of work, said about $700.
The supplement brand knew its numbers well. In its subscription, customers paid $59.22 an order and, at the peak, stayed about 14 months. That made each customer worth about $829, so paying $39 to win one was an easy yes, even when the first order lost money.
Then the brand cut most of its products, and the average stay fell to about seven months. By our math, seven months of $59.22 is about $415. Same brand, half the value per customer.
This is where owners fool themselves most. A year of repeat orders you hope for is not data. Count only what your bank and your churn rate, the share of customers who quit, actually show, and re-run it every month.
Losing money on the first sale on purpose only works with repeat numbers you have measured. Guess wrong and you overpaid for every customer you won.
No repeat numbers yet? Start with offer economics before launch, then come back.
When customers stayed half as long, each was worth half as much
Revenue per subscriber = $59.22 order x months stayed
- Peak: about 14 months 829
- Later: about 7 months 415
Example numbers from one subscription supplement brand. Not our results; we have not seen the account. $829 is the brand's figure; $415 is our arithmetic (7 x $59.22)
Revenue divided by customers landed within a few percent of the data team's answer
Two ways to estimate what one customer is worth
| Method | Time it took | Answer |
|---|---|---|
| Total revenue / total customers | Seconds | $724.26 |
| The business's data team | About a month | About $700 |
Example numbers from one course and coaching business. Not our results; we have not seen the accounts
Where the ceiling sheet goes wrong, and how to fix it
Most ceiling sheets break in the same few places. Here are three, each with a sign, a cause and a fix.
Cost per sale falls, and so does your return on ad spend. It looks like a win. In one example, seven hours of digging found the cause: strategy and economics, not anything inside the ad platform.
The fix: read cost per customer next to revenue per customer, never alone. A cheaper customer is not a better one if they spend less. Do one deep check of all your numbers each month.
Every tool shows a different number. The ad platform, your analytics and your store all disagree on sales. Pick one source of truth per number and never switch unless it is proven wrong.
The ceiling is out of date. Prices rose, shipping rose, or customers stay fewer months. Re-run the sheet monthly, and the same day anything big changes.
How to overpay for every customer in four easy steps. Step one: judge cost per sale by feel. Step two: blend every channel and product into one number.
Step three: count the repeat orders you hope for. Step four: when the cash runs out, blame the creative.
Congratulations. The ad platform had a hell of a quarter.
Counting the right result matters too. If your report counts the wrong kind of result, read results, not leads first.

Three ways a ceiling sheet goes wrong, and the fix for each
| Sign | Cause | Fix |
|---|---|---|
| Cost per sale falls, return falls too | Cheaper customers who spend less | Read cost per customer next to revenue per customer |
| Every tool shows a different sales count | No single source of truth | Pick one tool per number and stick to it |
| Ceiling looks fine, bank account disagrees | Prices, costs or repeat months changed | Re-run the sheet monthly and after any big change |
Our summary
Build your ceiling sheet with AI
The prompt below builds the whole sheet. Paste it into your preferred AI and answer its questions with your real numbers.
It asks before it guesses. It returns your ceiling, your max cost per click, a channel check, a product check and a kill list.
This week: first, run the prompt with last month's numbers. Second, write the ceiling on the first line of your ad report. Third, fix or pause every ad that sat above it for the past 7 days.
Launching something new with no sales yet? Start with how much to spend on a new offer, then come back once sales arrive.
Want a second pair of eyes on your sheet? Send it to us; you are not signing up for anything.
Back to that Monday meeting. Someone reads $46 again. This time the ceiling sits right next to it, and the meeting takes ten seconds.
Write the ceiling down once. Then let it do the arguing for you.
A finished Ceiling Sheet: six lines, two items to fix
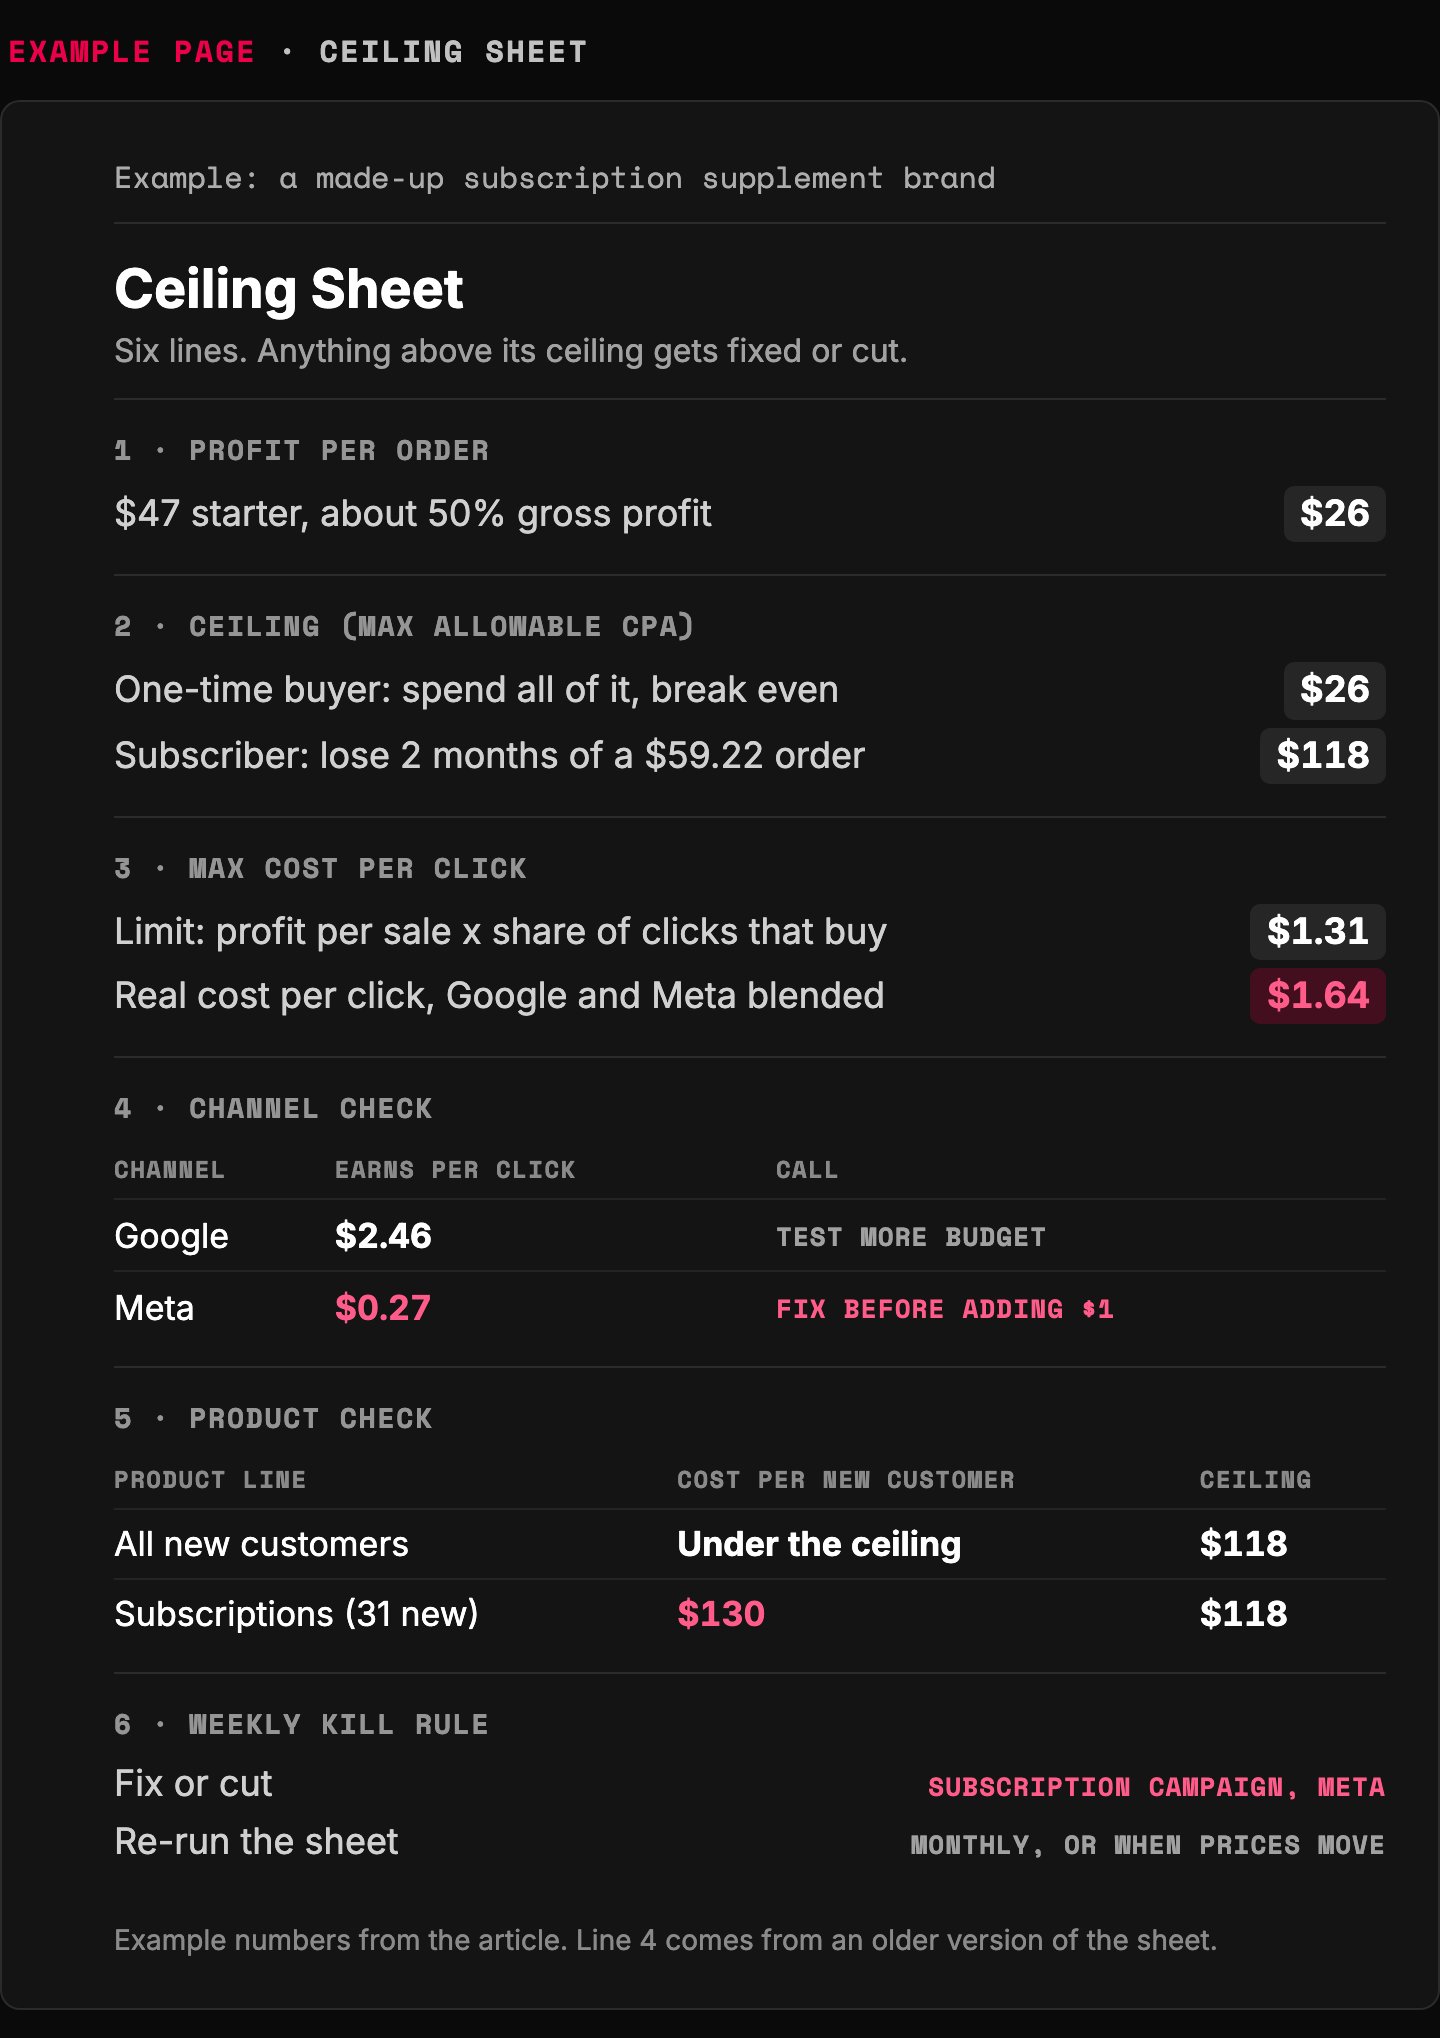
- Start from what one order earns after product, shipping, packing and card fees.
- The ceiling is a choice: two months of a $59.22 subscription, about $118.
- Red cell: clicks cost more than the $1.31 limit. A warning before the sales numbers show it.
- Judge each channel alone. Meta earned $0.27 a click, so fix it before adding a dollar.
- One product line, one ceiling. Subscriptions cost $130 against $118, hidden by the total.
Example page built for this article with a made-up brand. Numbers are the article's example sheet; line 4 comes from an older version of it
Paste into your preferred AI. It asks for your numbers, then returns your ceiling, click limit, channel and product checks, and a kill list.
Act as a careful analyst building my Ceiling Sheet for paid ads. Use only these rules and my answers. Never invent a number; if one is missing, ask me.

Ask one at a time, with the example, and wait:
1. What I sell: a one-time product, a subscription, or a service sold through leads or calls. (Example: subscription)
2. Average order value, or the price of one job. (Example: $52)
3. Cost to deliver one order: product, shipping, packing, card fees, labor. (Example: $26)
4. How much of one order's profit I will spend to win a customer. For a subscription: how many months of revenue I accept losing instead. (Example: 50%, or 2 months)
5. Subscriptions or repeat buyers only: monthly order value and how many months a customer stays, from my records. (Example: $59.22, 7 months)
6. Leads only: the share of leads that become customers. (Example: 1 in 4)
7. The share of ad clicks that end in a sale. (Example: 5%)
8. For each ad channel, last 7 days: spend, clicks, revenue, new customers. (Example: $1,000, 600 clicks, $1,400, 20)
9. For each product line, last 7 days: spend and new customers. (Example: subscriptions, $4,030, 31)

Rules:
- Profit per order = answer 2 minus answer 3.
- Ceiling (max allowable CPA): one-time product or service = profit per order x answer 4. Subscription = monthly order value x months of revenue I accept losing.
- Repeat value counts only from answer 5: monthly order value x months stayed. If answer 5 is missing, use the first order only and tell me so.
- Max cost per lead = ceiling x answer 6.
- Max cost per click = ceiling x answer 7.
- Per channel: cost per click = spend / clicks. Earnings per click = revenue / clicks. Cost per customer = spend / new customers.
- Per product line: cost per customer = spend / new customers, judged against that line's own ceiling.
- Kill or fix list: every channel or product line whose 7-day cost per customer is above its ceiling, or whose earnings per click is below its cost per click with no measured repeat value to cover it.
- Room to spend: ceiling minus cost per customer, for every line under its ceiling.
- If I type a cost target into an ad platform, suggest one below the ceiling, because platform targets are averages.

Show your math, then use exactly this format:
PROFIT PER ORDER:
CEILING (MAX ALLOWABLE CPA):
MAX COST PER LEAD:
MAX COST PER CLICK:
CHANNELS:
PRODUCT LINES:
KILL OR FIX THIS WEEK:
ROOM TO SPEND:
RE-RUN DATE: one month from today, or sooner if prices, costs or repeat numbers change.

Filip Kovacevic is the founder of Anar Agency in Phoenix. He spent five years running SEO, Meta ads, email, and content for medical practices across the United States, and now does the same work for healthcare, home-service, legal, and professional-service businesses, alongside AI implementation. More from Filip →
Talk it through in 15 minutes
Bring one question from this article. We will tell you what we would do, whether or not you hire us.
Book a 15-Min Chat →