Read 'Results', Not 'Leads': The Meta Reporting Mistake That Hides Winners

To read Meta ads reporting, judge each group of ads by its own Results column, not the Leads column. Results counts the exact goal that group was given, such as a booked call. Then split before deciding: the last 30 days, one group at a time, week by week, ad by ad.
One account-wide average hides winners.
How do you read Meta ads reporting without fooling yourself?
Picture a Monday ads meeting. The numbers here are made up. You have still sat in this room.
The Meta report shows one line: $175 a lead. Someone calls it too expensive. Turn it off.
Nobody asks what the number counts. Meanwhile, the best ad set in the account books calls at $35 each. The report shows it with zero leads.
Why zero? It was never asked to get leads. It was asked to get booked calls, and the Leads column does not count those.
Meta ads reporting is the set of numbers the platform shows about your ads: spend, results, cost per result and more. Reading it well is not hard math. It is knowing which number to read, over which dates, for which slice of the account.
Here is the short version. Read each ad set's own result. Split the numbers before you judge them.
Then check what those results turned into after the click. The rest of this guide shows how, in about ten minutes per account.
A total is not a verdict.
Same account, two reads, opposite decisions
One made-up account read two ways
| The blended read | The Segment-First Read |
|---|---|
| All campaigns, all time | Last 30 days, live ad sets only |
| One Leads column for everything | Each ad set's own result |
| $175 a lead | $35 per booked call, falling every week |
| Decision: switch it off | Decision: keep it, then check customers |
Made-up example account used through this article
What does Results mean in Meta ads reporting?
Results is the count of the one outcome each ad set was told to get. Meta's own definition ties it to the objective and settings you picked. So it counts different things in different ad sets, and that is the point.
An ad set is a group of ads that share one budget, one audience and one goal. Each has its own goal, so each has its own meaning of a result.
The Leads column is narrower. It counts lead events: a form filled in, a lead tracked on your site, a chat marked as a lead. A booked call or a custom event you defined can land in Results and never appear there.
So the first job is a definition, not a calculation. In How to Measure Anything in Cybersecurity Risk, Douglas Hubbard and Richard Seiersen start fuzzy measurement problems with one blunt question: what do you mean, exactly?
Ask it of every number on the report. Then write the answer beside each ad set: this one counts booked calls, that one counts form leads.
Skip that list and two people will argue about two different numbers on the same report. Both will feel right.
A column name is not a definition. Check it.
The labels and defaults Meta uses today are in the box below. The settings that quietly change what gets counted are in hidden Meta ads settings.

Each ad set's Results column counts its own goal
What the two ad sets in the example account count, and whether the Leads column sees it
| Ad set | Goal it was given | Results counts | Shows in Leads? |
|---|---|---|---|
| A: new offer, live | Get booked calls | 40 booked calls | No, 0 leads |
| B: spring form campaign, paused | Get form leads | 40 form leads | Yes, 40 leads |
Made-up example account used through this article
Meta's own words: Results counts the goal each ad set was given
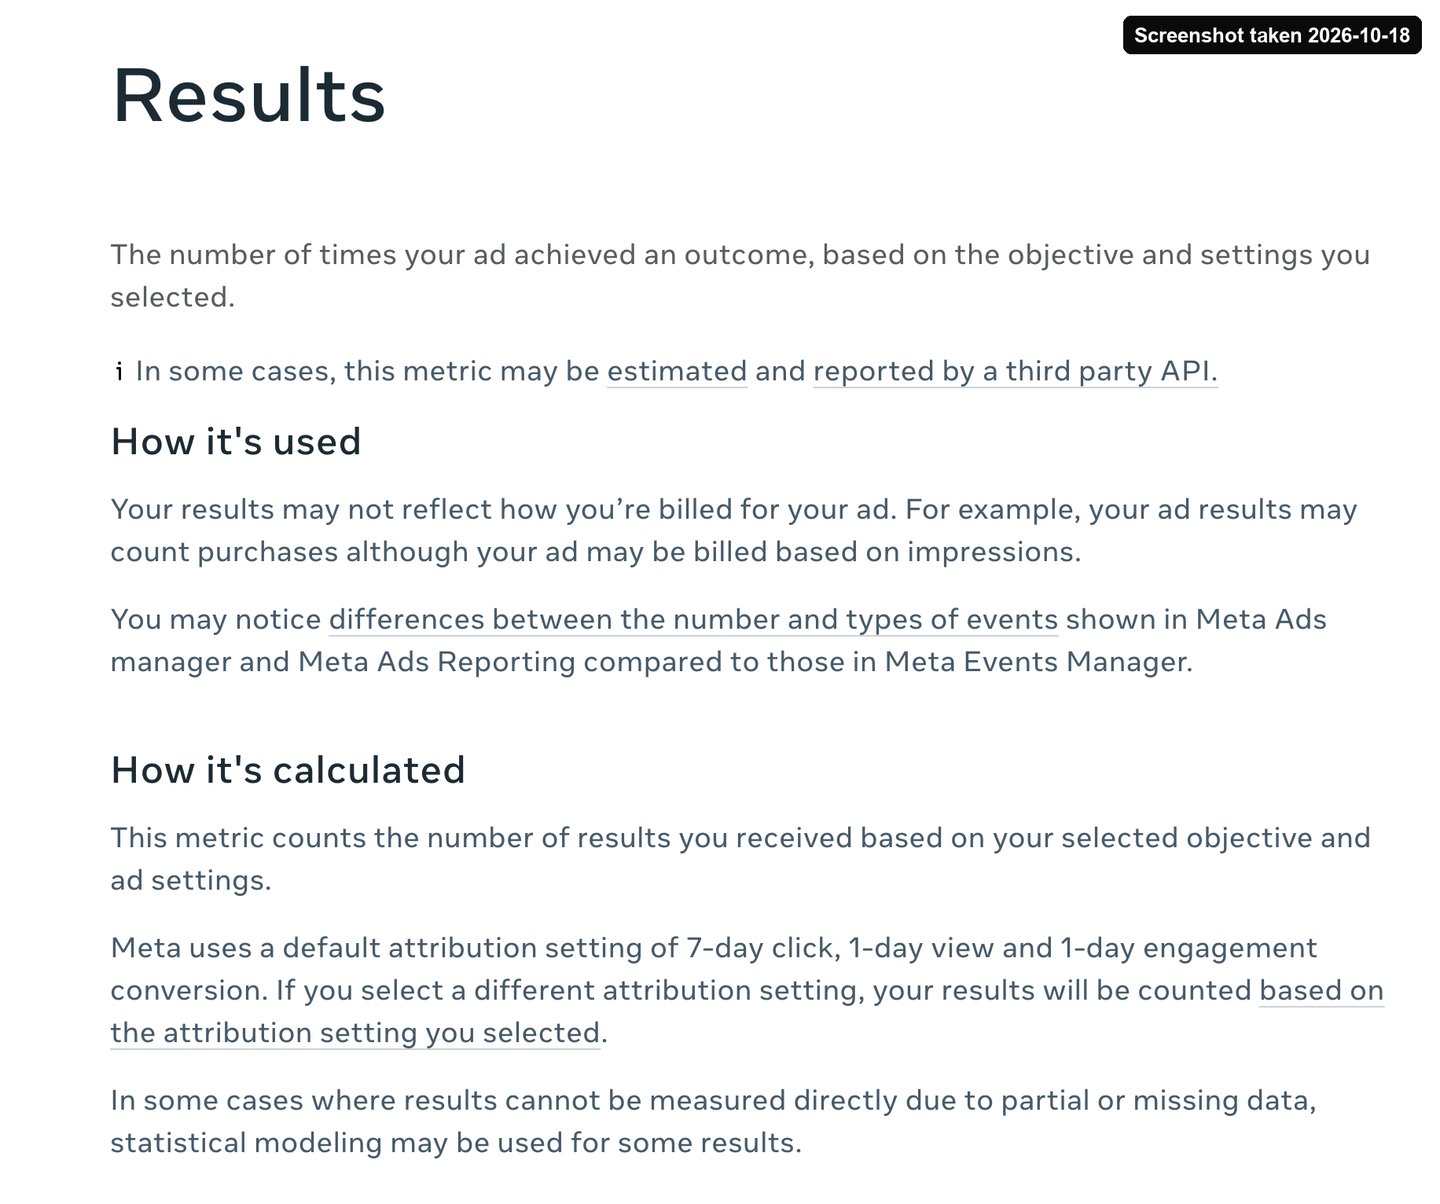
- Results means the goal you set. Different ad sets, different goals.
- Results is what you asked for, not what you pay for.
- These are the days a result can be credited. Note them beside every number.
- Some results are estimated. One more reason to count customers outside the platform.
Screenshot of Meta Business Help Center, Results, taken 2026-10-18
Never judge a Meta account on a blended total or on the Leads column alone. Make five cuts in order: which event each ad set counts as its result, the last 30 days of what is live, results and cost per result by ad set, the main ad set by week, and the best ad set by ad. Call anything under 10 results too early, or pull it toward its ad set's average before comparing.
State every number with its event, dates and ad set. Pick the cuts before looking and report weak ad sets next to strong ones. Then check outside the platform how many results became customers, and decide on cost per customer.
Why a blended cost per lead hides your best ad set
A blended cost per lead is one average across everything in the account. It mixes old and new, paused and live, failures and winners.
Statisticians have a name for what goes wrong: Simpson's paradox. The total tells one story. The parts tell the opposite one.
The famous case is graduate admissions at the University of California, Berkeley, in the fall of 1973. Overall, 44 percent of men who applied got in, against 35 percent of women. It looked like plain bias.
Split by department, the picture flipped. In the department with the most applicants, 82 percent of women got in, against 62 percent of men. Women had mostly applied to departments that were hard for anyone to enter.
Ad accounts work the same way. In our example account, the new ad set books calls at $35 each over the last 30 days. The old, paused form campaign brought leads at $140.
Blend them over the life of the account and you get $87.50 a result. Read only the Leads column and you get $175, because the $35 ad set shows zero leads.
Both numbers are real. Both are useless for the decision in front of you. That decision is about what is running now.
Switch off the account on that $175 and the $35 ad set goes with it. An all-time blend is a hell of a way to grade last month.
Overall, Berkeley admitted more men; in its biggest department, more women
Share of applicants admitted, fall 1973, percent
- Men, all departments 44
- Women, all departments 35
- Men, department A 62
- Women, department A 82
Wikipedia, Simpson's paradox, citing Bickel, Hammel and O'Connell, Science, 1975
Example: the blended numbers bury a $35 ad set
Cost per result in the example account, read four ways
- Ad set A, last 30 days 35
- Blended Results, all time 87.5
- Ad set B, paused 140
- Leads column, all time 175
Made-up example account used through this article: $1,400 / 40, $7,000 / 80, $5,600 / 40, $7,000 / 40
The Segment-First Read: five cuts before any verdict
The Segment-First Read is our order for reading an ad account: split it before you judge it. Each cut answers one question, and you make them in this order.
Cut one: which event? For each ad set, write down the goal it was given. That is what its Results column counts.
Cut two: which window? Use the last 30 days of what is live. Never all time, and never a range that still holds a campaign you stopped months ago.
Cut three: by ad set. Put results and cost per result side by side for each ad set. Cost per result is spend divided by results.
This is where a winner hiding in the average shows itself. In the example, $35 sits next to $140.
Cut four: by week. Split the main ad set into four weekly figures. Falling cost means it is improving; rising cost means something is wearing out.
Cut five: by ad. Inside the best ad set, find the one ad doing the work. That is the ad to learn from, as we explain in copy the rules, not the ad.
Nobody says a number out loud until all five cuts are done. Then every number comes with its labels: this event, these dates, this ad set.
Ten minutes. Five cuts. No more fights about a number nobody defined.
Five cuts, in this order, before anyone says the ads work or fail
- Which event? Write down each ad set's goal. That is what its result counts.
- Which window? The last 30 days of what is live. Never all time.
- By ad set Results and cost per result, side by side.
- By week Four weekly figures for the main ad set. Falling, flat or rising?
- By ad Find the ad carrying the best ad set. Under 10 results is too early.
Our method
Say every number with its event, dates and ad set
The same facts from the example account, said two ways
| Said in the meeting | Said with labels |
|---|---|
| "Leads cost $175" | $175 per form lead, all time, whole account: not fit for a decision |
| "The ads are expensive" | $35 per booked call, last 30 days, ad set A |
| "Ad 3 is our best ad" | Ad 3: 3 booked calls, too early to call |
Made-up example account used through this article
A finished read fits on one page, and every number carries its event, dates and ad set
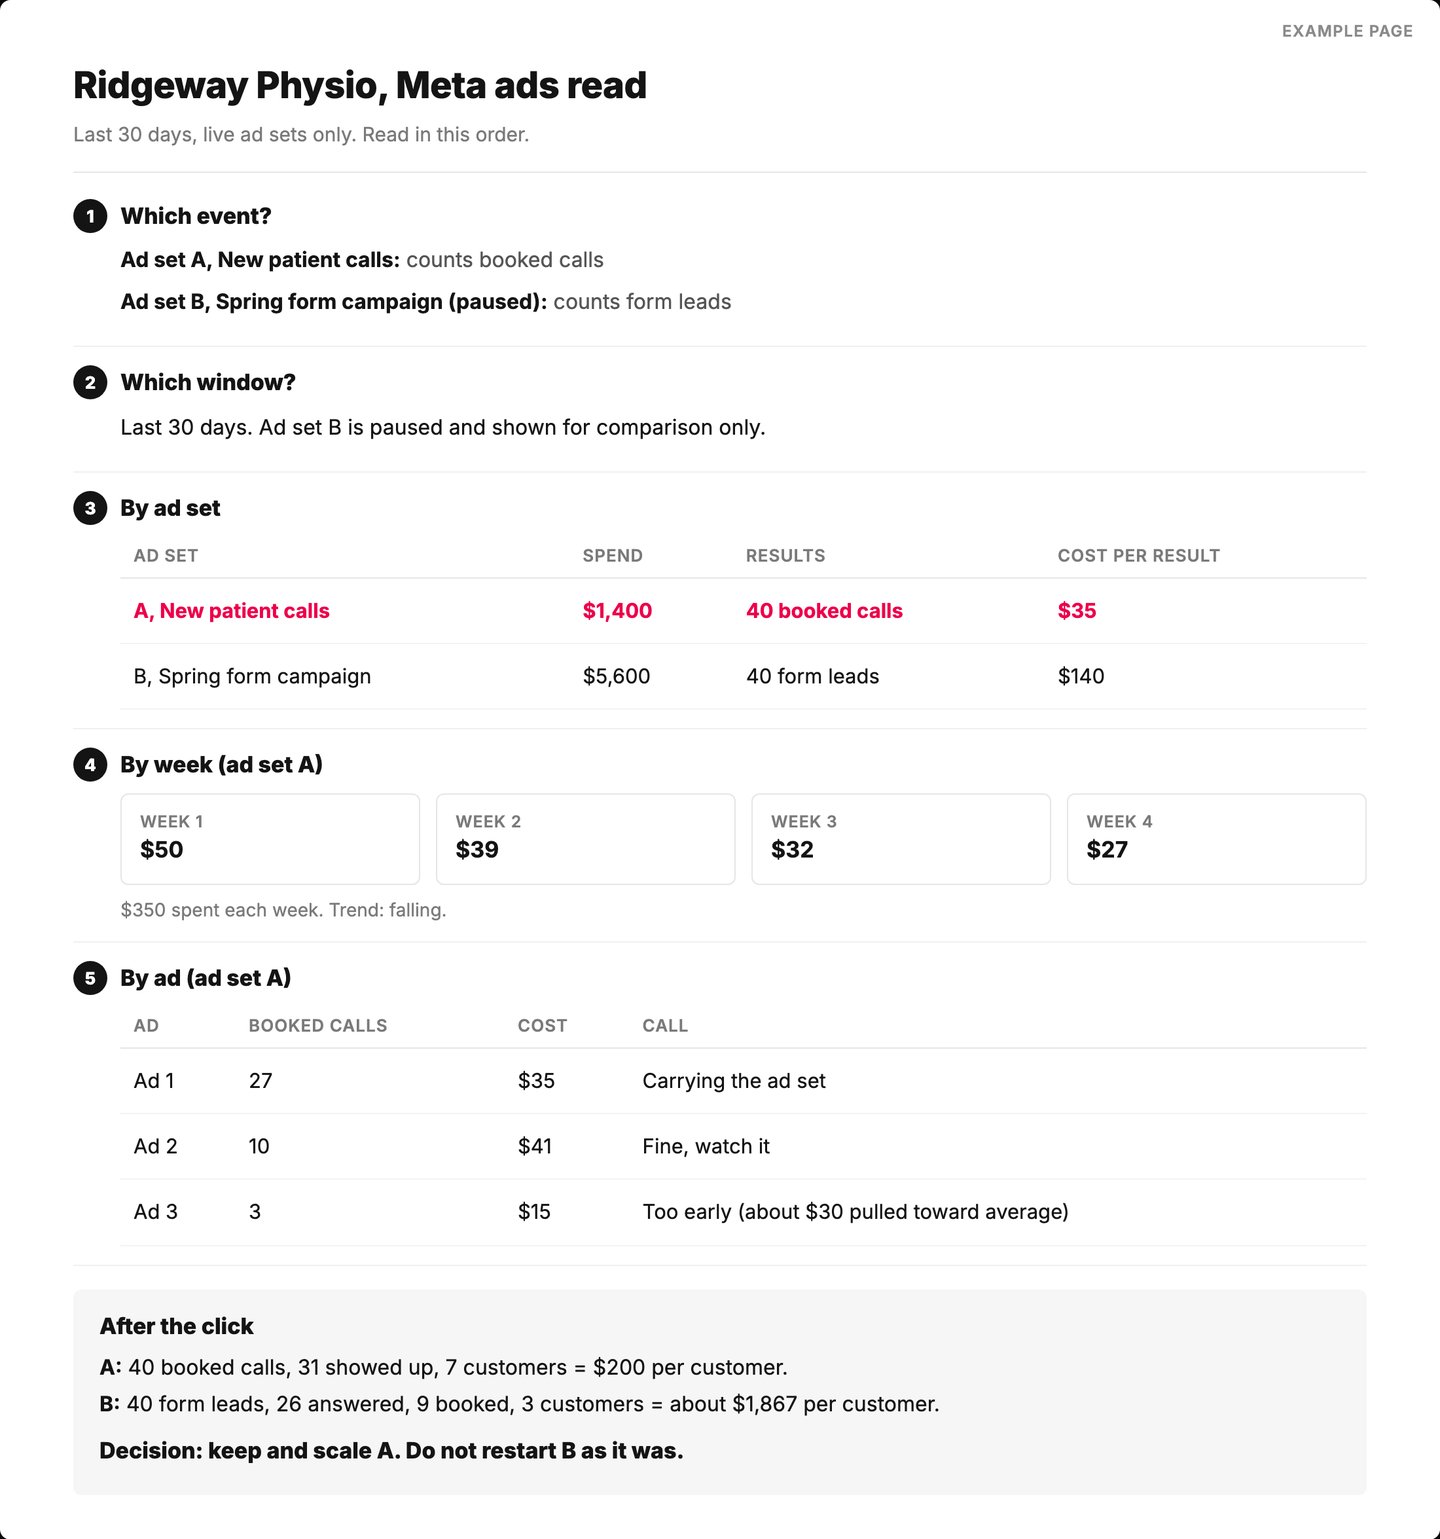
- Every ad set states what its result counts.
- One window for every number. Never all time.
- The winner the blended average was hiding.
- Four weeks show the direction. The average alone does not.
- Under 10 results is too early to call, good or bad.
Example page built for this article with a made-up business
Judge the trend by week, and never crown a tiny ad
One week proves very little in either direction. A very good or very bad week is usually followed by a more ordinary one, an effect called regression toward the mean.
So read four weeks in a row. In the example, the new ad set's cost per booked call went $50, $39, $32, then $27. Same spend each week, more calls each week.
Its 30-day average is $35, and that average runs behind the trend. The early weeks were the platform still learning who responds. The last week is closer to where the ad set stands now.
So is the $35 wrong? No. It is true, just out of date.
Still under four weeks old? Use the stop lines in launching ads for a new offer instead.
There is an opposite trap too: the tiny star. Inside that ad set, one ad shows $15 a call. It has three calls.
Hubbard and Seiersen picture this as a baseball batter who has only been up to bat a few times. A lucky streak gives him a sky-high average that will not last.
Our rule: under 10 results, an ad is too early to call, good or bad. To compare it anyway, pull it toward its ad set's average first. Pretend it already has 10 more results at that average cost.
Run that on the $15 ad: $45 spent plus $350, divided by 3 results plus 10, comes to about $30.
Still promising. Not a star. Check it again next week.
Example: weekly cost per call fell from $50 to $27 while the average said $35
Ad set A, cost per booked call by week, $350 spent each week
- Cost per booked call: Week 1 50, Week 2 39, Week 3 32, Week 4 27
Made-up example account used through this article: 7, 9, 11 and 13 booked calls at $350 a week
Example: a $15 ad with 3 results is a maybe, not a star
Ads inside ad set A, raw cost per call and pulled toward the $35 ad set average (10 extra results at $35)
| Ad | Spend | Booked calls | Raw cost | Pulled toward average | Call |
|---|---|---|---|---|---|
| Ad 1 | $945 | 27 | $35 | $35 | Carrying the ad set |
| Ad 2 | $410 | 10 | $41 | $38 | Fine, watch it |
| Ad 3 | $45 | 3 | $15 | about $30 | Too early |
Made-up example account used through this article. Pull-toward-average rule is ours: (spend + $350) / (calls + 10)
Pair every cost per result with what happened next
Results counts the event, not what the event was worth. Fifty cheap form fills that never answer the phone lose to ten calls that turn into customers.
Plain words help here. A lead is someone who might want what you sell. A prospect has a real problem they want solved, and a customer has paid.
So follow each ad set past the click. In the example, the new ad set's 40 booked calls became 31 people who showed up and 7 customers. That is $200 per customer.
The old form campaign's 40 leads became 26 people who answered the phone, 9 booked calls and 3 customers. That is about $1,867 per customer, more than nine times as much. Not close.
Compare each of those with the most you can pay for one customer. That comparison, not cost per result, decides what stays on.
Growth teams hit the same wall with sign-ups. In Hacking Growth, Sean Ellis and Morgan Brown walk through an example streaming service whose new sign-ups climbed to a record 450 in June. Its January group of 150 settled at about 95 paying, while the spring groups kept quitting.
Their fix is cohort analysis: group customers by when and where they came from, then track each group over time. In an ad account, the natural group is the ad set.
If leads go cold before anyone calls them, start with speed to lead. If results never come back from your site or sales records, fix tracking first with server-side conversion tracking.
A campaign can win the click count and lose the business. You only see it past the platform. Which step in that chain is broken is the subject of reading ad data.
Example: equal results, nine times the cost per customer
Both ad sets in the example account, followed past the click
| Step | A: booked calls | B: form leads |
|---|---|---|
| Results | 40 booked calls | 40 form leads |
| Next step reached | 31 showed up | 26 answered, 9 booked |
| Became customers | 7 | 3 |
| Spend | $1,400 | $5,600 |
| Cost per customer | $200 | about $1,867 |
Made-up example account used through this article
A record sign-up month can still be the worst group you ever bought
- January sign-ups in the book's streaming example 150
- of them still paying by July, when the group leveled off 95
- June sign-ups, the record month, whose group never leveled off 450
Hacking Growth, Ellis and Brown, cohort example (an illustration in the book, not a real company)
A lead is not a customer, and the report only counts the bottom rung
- Lead Someone who might want what you sell. Most ad results are this.
- Prospect Someone with a real problem they want solved, who has not picked a fix.
- Customer Someone who paid and now expects the result you promised.
Definitions adapted from Demand-Side Sales 101, Bob Moesta; our wording
What to ask when your agency sends one number
If your report is one line with one cost per lead, nobody can tell from it whether the ads work. That includes whoever sent it.
Ask three questions.
Which event counts as a result? Which dates does this cover? What does it look like split by ad set and by week?
Then one more: how many of those results became customers? A good manager answers all four in a few minutes. If the answer takes a week, that is your answer.
In High Output Management, Andrew Grove, who ran Intel, says to judge a salesperson by orders won, not calls made. He also pairs every count with a quality check, so chasing one number cannot quietly wreck another.
Watch the other direction too. Splitting is not a hunt for the one slice that flatters. Slice enough ways and something always looks great by luck, the multiple comparisons problem.
So pick your cuts before you look, and report the weak ad sets next to the strong. Want a fair head-to-head? Run a real test, as in one-variable ad testing.
How to kill your best ad set in four easy steps. Step one: read the all-time total. Step two: read the Leads column on a campaign built for booked calls.
Step three: average the new ads with the ones you paused last spring. Step four: switch it all off and call it discipline.
Congratulations. You just fired your best ad set for missing a goal it was never given.
One number cannot tell you if the ads work; four labels can
| One-line report | Segment-First report |
|---|---|
| Cost per lead: $175 | Cost per result for each ad set, with its event |
| Dates not stated | Last 30 days of live ad sets |
| No split | By ad set, by week, by ad |
| Stops at the platform | Results, then customers, then cost per customer |
Our method
Decide on cost and what the results became, never on cost alone
- Scale Cheap results that turn into customers.
- Keep Pricier results, but cost per customer stays under your max.
- Fix Cheap results nobody buys from: check the form, follow-up and audience.
- Stop Costly results and few customers, once it has 10 or more results.
Our method
Run the Segment-First Read with AI this week
The prompt below runs the whole read for you. Paste it into your preferred AI with an export of your account. It asks for anything missing.
It never guesses a number. It labels every figure with its event, its dates and its ad set.
This week: first, write down the goal of every live ad set. Second, run the five cuts on the last 30 days. Third, count how many results became customers.
Want a second pair of eyes on your read? Send us the export; you are not signing up for anything.
Back to that Monday meeting. The $175 was real, and the account was working. The number simply answered a question nobody asked.
A total is a crowd photo. Zoom in before you switch anything off.
Paste into your preferred AI with an export of your account. It asks five questions, then gives a decision per ad set.
Act as a careful ad analyst. Read my Meta ads account with the Segment-First Read. Use only my data and answers. Never invent a number; if one is missing, ask me.
If you can browse, first check Meta's current help pages for the Results, Cost per result and Leads metrics and the default attribution setting, and tell me if anything below has changed.

Ask one at a time, with the example, and wait:
1. Paste an export: one row per ad set for the last 30 days, with spend, results, result type and leads. (Example: New offer, $1,400, 40, booked calls, 0)
2. The same ad sets split by week for the last 4 weeks. (Example: week 1, $350, 7 results)
3. The best ad set split by ad. (Example: Ad 3, $45, 3 results)
4. For each ad set, how many results became customers, from your sales records. (Example: 40 booked calls, 7 customers)
5. The most you can pay for one customer. (Example: $400, or I don't know)

Rules:
- Read each ad set by its own result type. Never add up results of different types.
- Use only the last 30 days of live ad sets. Mark any all-time or account-wide average as not fit for a decision.
- Cost per result = spend / results, per ad set.
- Weekly trend: is cost per result falling, flat or rising across the 4 weeks?
- Under 10 results: label it TOO EARLY. To compare it anyway, add 10 results at its ad set's average cost, then recompute.
- Cost per customer = spend / customers. Compare it with answer 5.
- Decide per ad set: cheap results and many customers = scale; costly results but cost per customer under answer 5 = keep; cheap results and few customers = fix the form, follow-up or audience; cost per customer over answer 5 = stop. Never scale or stop on fewer than 10 results.
- List weak ad sets next to strong ones. Do not hunt for a flattering slice.

Show your math, then use exactly this format:
EVENT PER AD SET:
LAST 30 DAYS BY AD SET:
WEEKLY TREND:
AD CARRYING THE BEST AD SET:
TOO EARLY TO CALL:
COST PER CUSTOMER:
DECISION PER AD SET:
NEXT THREE ACTIONS:

Filip Kovacevic is the founder of Anar Agency in Phoenix. He spent five years running SEO, Meta ads, email, and content for medical practices across the United States, and now does the same work for healthcare, home-service, legal, and professional-service businesses, alongside AI implementation. More from Filip →
Talk it through in 15 minutes
Bring one question from this article. We will tell you what we would do, whether or not you hire us.
Book a 15-Min Chat →