Offer Economics Before Launch: Allowable Cost and the Churn Ceiling

Before you spend on ads, write four numbers for one customer. What they pay you, with each extra counted at the share who buy it. What it costs to serve them, refunds included.
What is left. And what you can pay to win them after your profit. If customers cost more, change the offer.
Offer economics: do the sum before the first ad runs
A cinema pass once cost $9.95 a month. Members could see one film every day.
Each time a member checked in, the company loaded the full ticket price onto a payment card. So it paid full price for every film. Two films could cost it more than the $9.95 fee.
By June 2018 it had over three million members. The service shut down in September 2019.
Nobody needed hindsight. One line on a sheet showed it on day one: the fee minus the ticket costs.
That line is offer economics. What one customer pays you, what serving them costs, and what is left to win the next one.
Most small offers never die that loudly. They just run out of money by month three.
Here is the whole answer up front. Fill four lines for one customer. If the last line is lower than what customers cost in your market, fix the offer, not the ads.
Selling something recurring? Add one more number. It tells you where growth stops.
A $9.95 pass signed up millions, then shut down
One film a day for a flat monthly fee, with the company paying full price for each ticket
- a month, one film a day 9.95
- members by June 2018 3 million+
- the service shut down Sept 2019
Source: Wikipedia, MoviePass
Four lines tell you if an offer can pay for its own ads
- 1. What a buyer pays Main price, plus each extra times the share who take it.
- 2. What it costs to deliver Product, labor, fees and refunds.
- 3. What is left Line 1 minus line 2: the margin.
- 4. What you can pay to win one The margin minus the profit you keep. Too low? Fix the offer.
Our method
What does one customer pay you? Count each extra at its take rate
Line one is what a typical buyer pays you. Not your best buyer. The typical one.
Start with the main price. Then add every extra: an add-on at checkout, an upsell after the sale, a renewal.
Each extra counts only at its take rate. The take rate is the share of buyers who say yes to it.
For example, a $300 upsell taken by 12 percent of buyers adds $36 per buyer. Not $300. Thirty-six.
Our rule: every extra goes in at the take rate you have seen. No data yet? Use a low guess.
Sometimes a smaller line one is the better deal. For example, one business sold a $297 upsell that about 12 percent of buyers took. Its average order was $87.19.
Then it modeled a cheaper upsell taken by 30 percent of buyers. The average order fell to $80.65. That is a small drop.
But upsell buyers went from about 12 in every 100 to 30. Why care about that?
In that case, upsell buyers later bought the big program at 12 to 14 percent. Buyers who skipped the upsell bought it at about 3 percent.
So a $6.54 drop per order bought almost three times as many strong prospects. That trade only pays if your cost to win a buyer is already under control.
Building that next step well is its own job. Start with the next-problem upsell.
Example: a $100 offer is worth $150 a buyer, not $450
Each extra counts at its take rate, the share of buyers who say yes
| Item | Price | Take rate | Counts as |
|---|---|---|---|
| Main offer | $100 | 100% | $100 |
| Add-on at checkout | $50 | 28% | $14 |
| Upsell after the sale | $300 | 12% | $36 |
| Line 1: what a buyer pays | $150 |
Example prices and take rates
A cheaper upsell cost $6.54 an order and nearly tripled upsell buyers
| $297 upsell, about 12% take | Cheaper upsell, 30% take (modeled) |
|---|---|
| Average order: $87.19 | Average order: $80.65 |
| About 12 upsell buyers per 100 | 30 upsell buyers per 100 |
| Fewer people to offer the big program | Almost three times as many to offer it |
Example numbers from one business, not verified by us; the 30% case was modeled, not measured
Before launch, fill four lines for one customer. One: what they pay, with each extra counted at its take rate. Two: what serving them costs, refunds included.
Three: the margin. Four: the allowable cost, which is the margin minus the profit you keep. If customers cost more than line four in your market, change the offer, not the ads.
For a recurring offer, find the churn ceiling: new customers a month divided by monthly churn, the standard formula also known as the growth ceiling. Plan with low sale rates and rising click costs, pick one source per number, and review the sheet every month.
What does it cost to deliver? Put refunds on line two
Line two is what it costs to serve that buyer. Product, labor, payment fees and refunds.
Refunds are the line people skip. They are a cost like any other.
How high should you guess? For a good offer, plan on under 5 percent. That is a rule of thumb, not a measured number.
For example, one seller thought 20 to 30 percent was normal, because those were the only offers he had run. On a later offer, he saw one refund in 490 sales.
That gap can make or break the business. On a $150 buyer, 30 percent refunds cost $45. Five percent costs $7.50.
Weak extras push refunds up. On an earlier offer, the same seller added a second upsell that was not very good. Refunds rose from about 30 percent to 40 percent.
Our rule: test every new extra on its own before it joins the funnel. A bad upsell does not just fail. It drags the main sale down with it.
Refunds start with the promise you made. For that side, read what buyers fear losing.
Plan refunds near 5 percent, not the 20 to 30 percent one seller thought was normal
Example refund rates from one seller's offers, and how much weight each deserves
| Refund rate | Where it comes from | How sure |
|---|---|---|
| 20 to 30% | What he thought was normal, from the offers he had run | His old frame of reference |
| Under 5% | A common rule of thumb for good offers | Rule of thumb, not measured by us |
| About 0.2% | His later offer: 1 refund in 490 sales | His number, not verified |
| 30% to 40% | An earlier offer, after adding a weak second upsell | His number, not verified |
Example numbers from one business, not verified by us
What can you pay to win one customer? The margin minus your profit
Line three is what is left: line one minus line two. Accountants call it the contribution margin.
Line four is what you can pay to win one buyer. Take the margin and subtract the profit you want to keep.
That is your allowable cost.
Marketers call what you actually pay the customer acquisition cost. The sheet sets the most it is allowed to be, before any ad runs.
Now turn line four into a click. Multiply the allowable cost by the share of visitors who buy. That is the most one click can cost.
For example, a $60 allowable cost and a page where 2 percent buy gives $1.20 a click. Pay $3 a click and you lose money on every sale.
Mark every click cost above that limit in red. For example, on one offer a $15 click meant the math could never work. No ad fixes that.
If line four sits below what customers cost in your market, stop. Raise the price, cut the delivery cost, add an extra more people want, or give buyers a reason to come back.
Better ads cannot close a gap in the arithmetic. Once ads are live, check the real cost against your max allowable cost per acquisition (CPA).
Judging traffic by sales per visit, not clicks alone? See earnings per session.
Example: $150 a buyer leaves $60 to win the next one
The four lines for the example offer above
| Line | What goes in | Example |
|---|---|---|
| 1. What a buyer pays | Main price plus extras at take rate | $150 |
| 2. Cost to deliver | Product and labor $20, fees $4.50, refunds at 5% $7.50 | $32 |
| 3. What is left | Line 1 minus line 2 | $118 |
| 4. Allowable cost | Line 3 minus the $58 profit you keep | $60 |
Example figures
Example: a $60 allowable cost allows a $1.20 click when 2 percent buy
Most a click can cost = $60 x the share of visitors who buy
- 1% of visitors buy 0.6
- 2% buy 1.2
- 5% buy 3
Example math from the sheet above
Four lines for one customer, and a click cost marked red
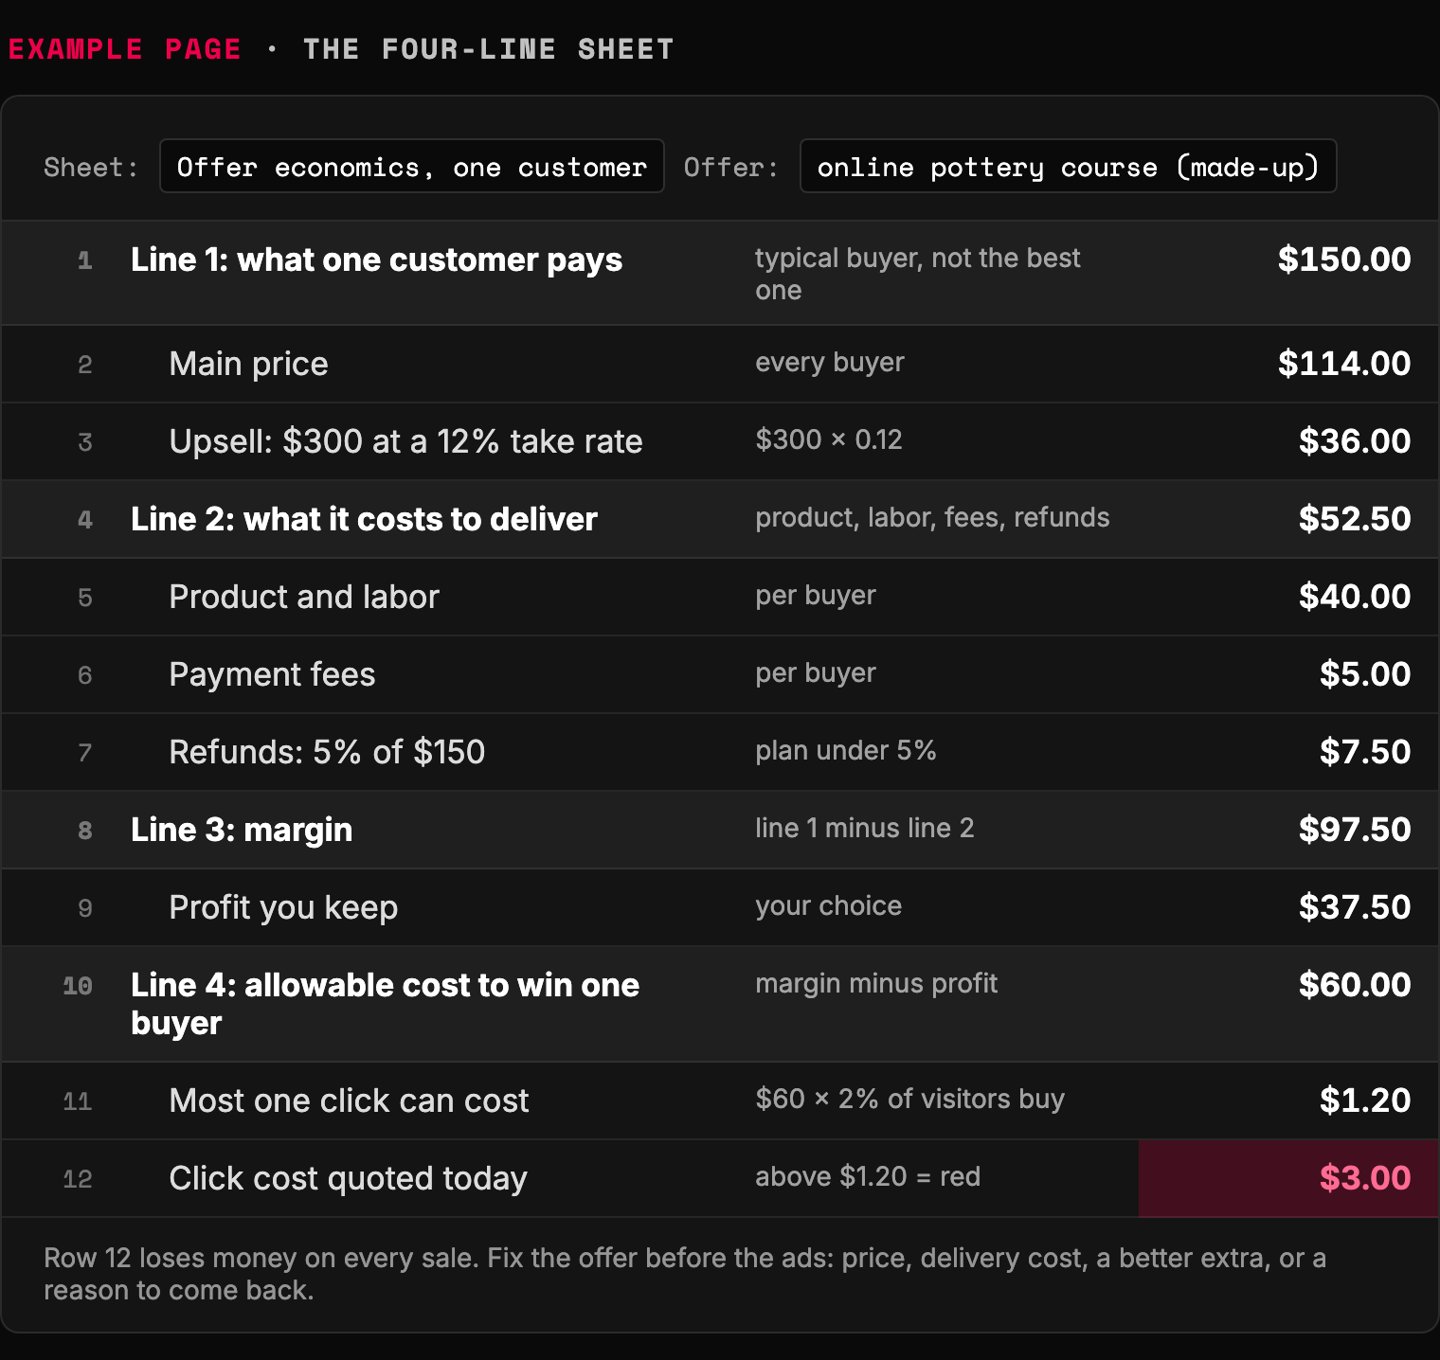
- Each extra counts at its take rate: $300 times 12 percent is $36, not $300.
- Refunds go on line two. For a good offer, plan under 5 percent.
- Line 4: the margin minus the profit you keep. The most you can pay to win one buyer.
- Line 4 times the share who buy: $60 times 2 percent is $1.20 a click.
- A $3 click is above the limit, so it goes red. No ad fixes that.
Example page built for this article with a made-up brand. The course and its numbers are made up; the $60, 2 percent, $1.20 and $3 figures and the 12 percent upsell are the article's own examples.
Plan with the numbers you would hate to get
Every plan is written by an optimist. Researchers call it optimism bias. Its cousin, the planning fallacy, is why forecasts run rosy.
So plan low on purpose. Set your first-offer sale rate at 6 percent, even if your template starts at 10 to 15 percent.
For the big program sold later, plan on 2 percent. Why so low? A low guess is easy to beat.
A best-case guess can only let you down.
Plan click costs high, too. They climb as you spend more, a textbook case of diminishing returns.
For example, one business paid about $2.35 a click at $500 a day. It expected to pay far more per click at $5,000 a day.
So raise the cost per click on your sheet whenever you plan a bigger budget. If the offer still works with pricier clicks, it can grow.
How to launch a money pit in four easy steps:
1. Assume a 20 percent sale rate. You are great at marketing, after all.
2. Count the upsell as if every buyer takes it.
3. Leave refunds off the sheet. They ruin the mood.
4. Learn the real numbers in month three, from your bank. A damn expensive way to learn arithmetic.
For the test budget itself, see how much to spend on a new offer.

Example: plan at 6 percent and 1,000 visitors make 60 buyers, not 150
Buyers from 1,000 visitors at three planned sale rates
- 15% (hopeful) 150
- 10% 100
- 6% (cautious) 60
Example math; 6% against a 10 to 15% default is our planning rule
A cautious sheet sets numbers you can beat
| Hopeful sheet | Cautious sheet |
|---|---|
| Sale rate at your best guess | Sale rate under your guess |
| Big program at your best month | Big program at 2% |
| Today's click cost at any budget | Pricier clicks at a bigger budget |
| Refunds left out | Refunds near 5% |
| Reality usually falls short | Reality usually beats it |
Our method and planning rates
Where does a recurring offer stop growing? At the churn ceiling
A recurring offer has a ceiling, and you can find it before launch. Every month, some customers leave. The share who leave is your churn rate.
Churn is a percentage of everyone you have. New customers are a fixed number each month. So the more customers you have, the more leave each month.
At some point, the number leaving each month equals the number joining. Growth stops.
That point is the churn ceiling: new customers a month divided by monthly churn. It is a standard formula, not ours.
ChartMogul, a subscription analytics firm, calls it the growth ceiling. We use the plain name churn ceiling, because churn sets its height.
For example, 100 new customers a month at 5 percent churn tops out near 2,000 customers. At 30 percent churn, near 333.
For example, one business lived the 30 percent case. Every push to scale its offer hit the same wall.
Sales grew for three months. Then its customer count stopped growing by month four or five. It kept winning customers and kept losing them.
The owner could not see why until the numbers went on a chart. The ceiling had been there all along.
So how do you raise it? Win more customers each month, or lose fewer.
Cutting churn moves it more than you would think. From 5 percent to 4, the ceiling rises from 2,000 to 2,500.
Referrals are the exception. If happy customers bring in more new ones than you lose, the ceiling stops being a ceiling.
Why members stay or cancel is its own topic. Read recurring models that stick.
Example: at 30 percent churn, growth flattens by month six
Customers on the books with 100 new each month
- 5% churn: 1 100, 3 285, 6 530, 9 740, 12 919, 18 1206, 24 1416
- 30% churn: 1 100, 3 219, 6 294, 9 320, 12 329, 18 333, 24 333
Example math: last month's customers x (1 - churn) + 100 new
Cut churn from 5 to 4 percent and the ceiling rises by 500
Churn ceiling = 100 new customers a month / monthly churn
- 30% churn 333
- 10% churn 1000
- 5% churn 2000
- 4% churn 2500
- 2% churn 5000
Example math; formula from ChartMogul, The SaaS growth ceiling
New customers divided by churn: the ceiling a recurring offer cannot pass
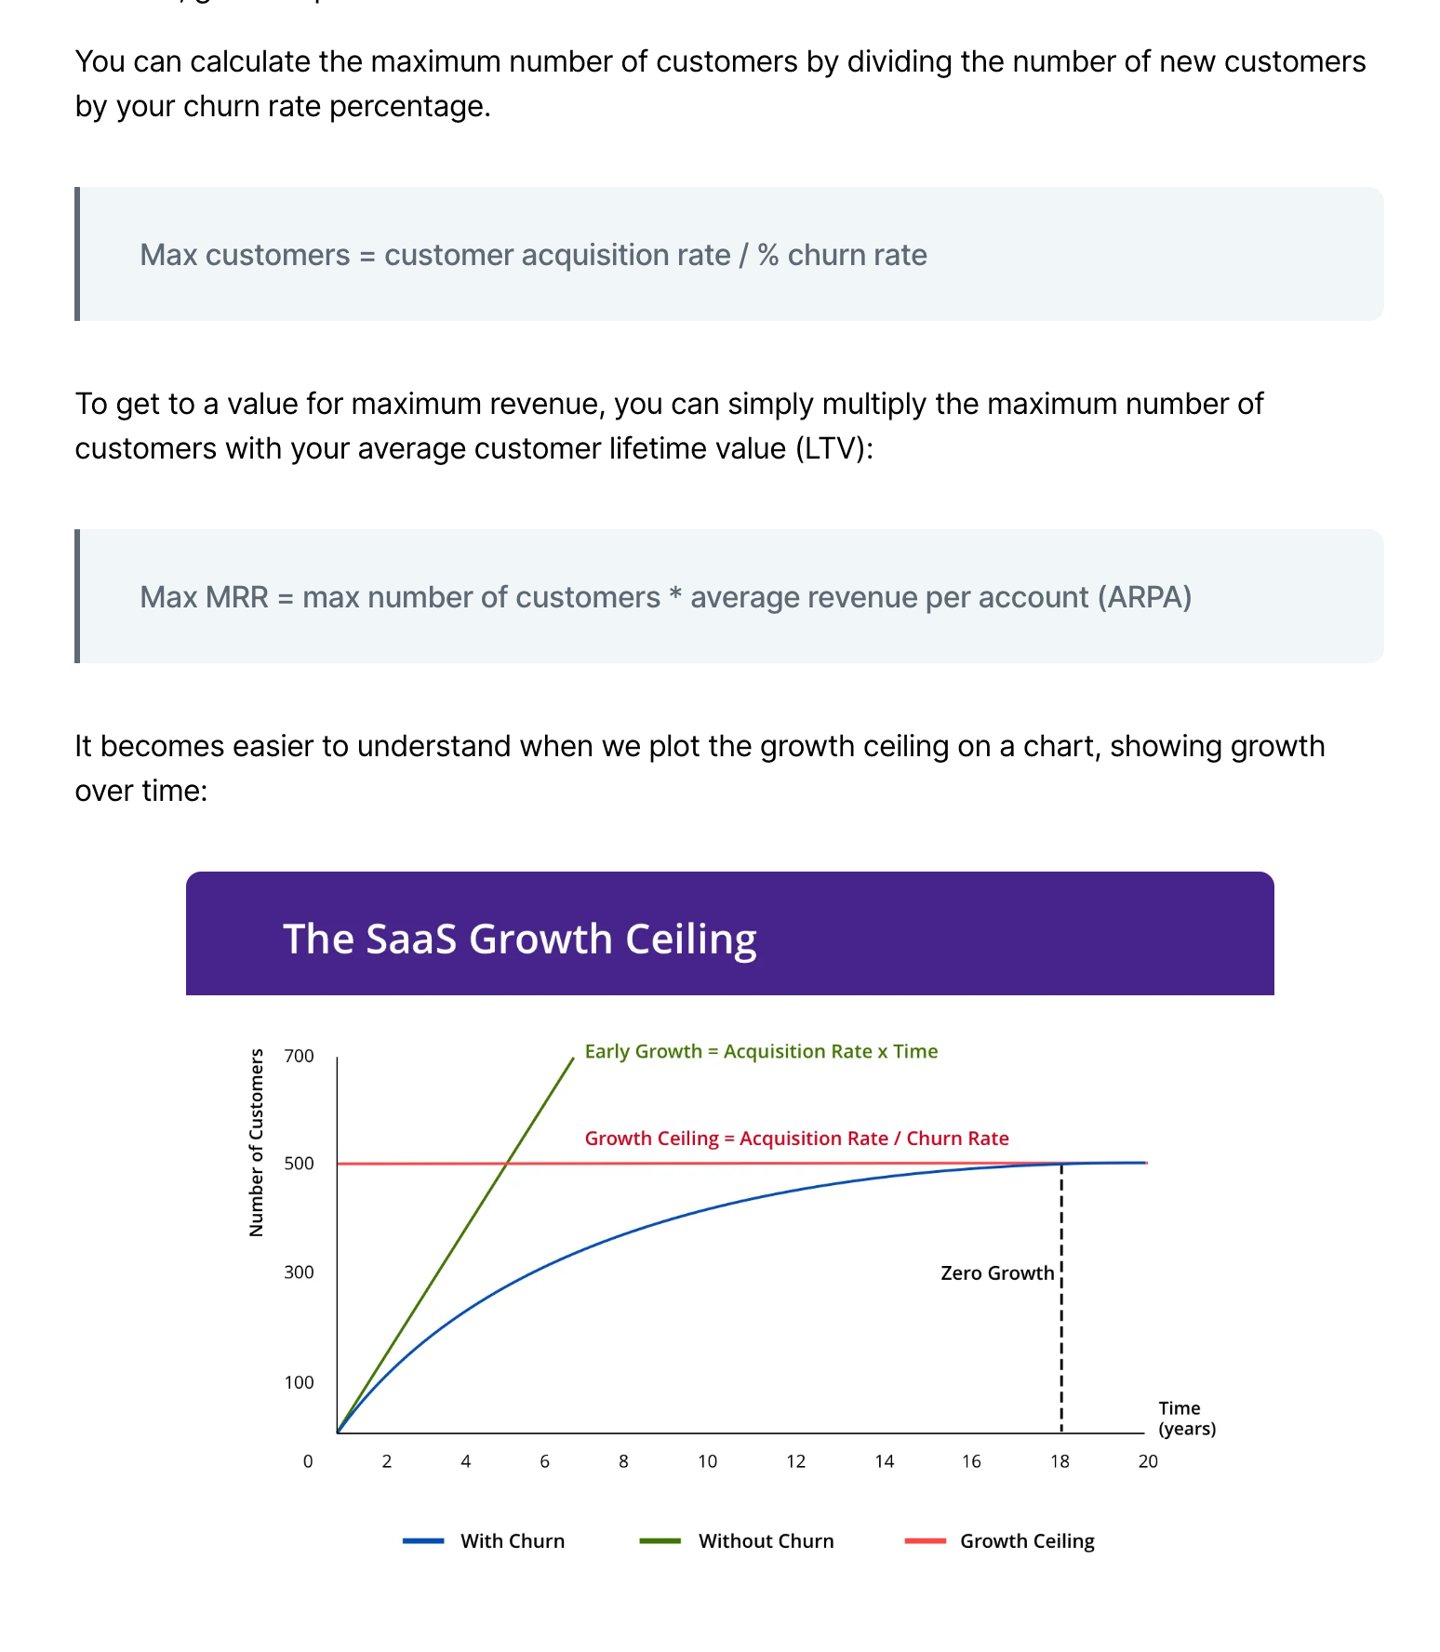
- New customers divided by churn. A standard formula, not ours.
- ChartMogul calls this the growth ceiling. We call it the churn ceiling, because churn sets its height.
- Growth flattens where the number leaving equals the number joining. Same sum, monthly: 100 new a month at 5 percent churn tops out near 2,000.
Screenshot of ChartMogul, The SaaS growth ceiling (blog), taken 2026-10-17. The article names ChartMogul as the source of the term.
What is one customer worth over time? Total revenue divided by customers
With repeat buying, line one is bigger than the first sale. That bigger number is customer lifetime value.
The quick version: total revenue divided by total customers. Two numbers. One division.
For example, one large company with its own data team checked it. The quick figure came out near $724.
The team's month of work said about $700. Close enough to plan with.
Want profit, not sales? Multiply total revenue by your gross margin first. Then divide by customers.
Sell one-off jobs, not memberships? It still applies. For example, if a quarter of your customers return within a year, one customer is worth more than one job.
Count only repeat buying you have seen. Hope is not a line item.
A higher lifetime value raises line four. It also moves your break-even point closer.
Example: two quick ways to put a value on one customer
Napkin math from two numbers you already have
| Number | Formula | Example |
|---|---|---|
| Lifetime value | Total revenue / total customers | $500,000 / 800 = $625 |
| Lifetime gross profit | Total revenue x gross margin / total customers | $500,000 x 60% / 800 = $375 |
Example figures; standard napkin formulas
Pick one source for each number, then check it every month
Your ad platform, your analytics and your bank will disagree. Every time.
So pick one source of truth for each number. Spend from one place, sales from one, refunds from one.
Then keep it. Do not switch because another tool shows nicer numbers this week.
If your own system lags, take ad spend from a single reporting tool. Take units from the sales system. Mixed sources lead to really bad decisions.
Then hold a monthly review: real numbers beside the sheet. For example, one review of a single client took about seven hours.
The cost per sale was falling. So was the return on ad spend. Something was off.
The cause sat outside the ad platform. It was the offer's strategy and economics.
The point is not the arithmetic. It is finding the one line that moved.
When a line moves, reading ad data shows which metric broke.
Pick one source per number and never switch to the one with nicer numbers
| Number | Count it from | Why |
|---|---|---|
| Ad spend | The ad platform's billing | It is what you were charged |
| Sales and take rates | Your cart or checkout | It records each order |
| Refunds | Your payment processor | Money back is money gone |
| Customers and churn | Your billing or member system | It knows who still pays |
Our rule. Pick your own sources, then keep them
Once a month, find the one line that moved
- Pull Last month's real numbers from your sources.
- Compare Put them beside the sheet.
- Find The line that moved most.
- Fix That one thing, not five.
- Update The sheet, for next month.
Our method
Run the four-line sheet with AI this week
The prompt below runs the whole sheet for you. Paste it into your preferred AI and answer its questions one at a time.
It shows its math and never invents a number. Missing one? It asks.
1. Run it for your main offer, with your real prices.
2. Replace every guess it lists with a real number before launch.
3. Pick your sources of truth and book the first monthly review.
Sheet says the offer cannot work? Go back to offers start with principles before you touch an ad.
Want a second pair of eyes? Send us your sheet.
The cinema pass had millions of members and one bad line on its sheet. Check yours before launch, not after.
Write the four lines first. The bank checks your math either way.
Paste into your preferred AI. It asks for your prices, costs and rates, then returns the four lines, your click line and your churn ceiling.
Act as a careful offer analyst. Check whether my offer can pay for its own ads before I launch it. Use only these rules and my answers. Never invent a number; if one is missing, ask me for it or for a cautious guess, and label every guess.

Ask one at a time, with the example, and wait:
1. What the offer is and who buys it. (Example: a $100 course for home bakers)
2. Every price a buyer can pay: main offer, checkout add-on, each upsell, any renewal. (Example: $100, $50, $300)
3. The share of buyers who take each extra. If I have no data, ask for my guess and cut it by a third. (Example: add-on 28%, upsell 12%)
4. What it costs to deliver one sale: product, labor, payment fees. (Example: $20 plus $4.50 in fees)
5. My refund rate. If I have no data, use 5 percent and say so. (Example: 5%)
6. The profit I want to keep per buyer. (Example: $58)
7. The share of visitors I expect to buy. Use 6 percent or my guess, whichever is lower. (Example: 6%)
8. What a click or a customer costs in my market today, if I know. (Example: $1.10 a click)
9. Is it recurring? If yes: new customers I expect a month and monthly churn. (Example: 100 a month, 5%)

Rules:
- Line 1, what a buyer pays = main price + each extra x its take rate.
- Line 2, cost to deliver = delivery costs + fees + (line 1 x refund rate).
- Line 3, margin = line 1 - line 2.
- Line 4, allowable cost = line 3 - the profit I keep.
- Most a click can cost = line 4 x the share of visitors who buy.
- If answer 8 is above that click line, say the offer fails at today's costs. Then list which change fixes it: a higher price, a cheaper delivery, an extra more buyers take, or repeat buying. Show the new line 4 for each.
- Rerun the click line with clicks 50 percent more expensive, for a bigger budget. Say if the offer still works.
- If recurring: churn ceiling = new customers a month / monthly churn. This is the standard growth ceiling formula. Show the ceiling at my churn and at churn one point lower.

Show your math, then use exactly this format:
LINE 1 WHAT A BUYER PAYS:
LINE 2 COST TO DELIVER:
LINE 3 MARGIN:
LINE 4 ALLOWABLE COST:
MOST A CLICK CAN COST:
VERDICT (launch, fix the offer, or stop):
CHURN CEILING (if recurring):
GUESSES I SHOULD REPLACE WITH REAL NUMBERS:
NEXT THREE ACTIONS:

Filip Kovacevic is the founder of Anar Agency in Phoenix. He spent five years running SEO, Meta ads, email, and content for medical practices across the United States, and now does the same work for healthcare, home-service, legal, and professional-service businesses, alongside AI implementation. More from Filip →
Talk it through in 15 minutes
Bring one question from this article. We will tell you what we would do, whether or not you hire us.
Book a 15-Min Chat →