How to Measure a Marketing Engineer: KPIs Built on What Buyers Did

Measure a marketing engineer by what buyers did because of their systems, not by how much the systems produced. Give each system one number tied to sales, like replies from people who could actually buy, not emails sent. Pair it with a check against cheating, a line showing the system ran, and honest hours saved.
How do you measure a marketing engineer's work?
The monthly report says 4,000 emails went out. The chart points up and to the right. Everyone nods.
Nobody asks the only question that matters. How many of those people wanted to buy?
Sending is the easiest number in marketing to grow. Point an AI agent at a list and it sends as many as you let it.
That is not output. That is noise with a send button.
Most lists of marketing engineer KPIs count motion: tasks automated, posts shipped, dashboards built. We grade what buyers did instead.
The term is older than the job title. Professors Gary Lilien and Arvind Rangaswamy named marketing engineering for turning data and judgment into tools that improve marketing decisions. Today's marketing engineer also builds the systems: the pipelines, the AI agents, the tests.
So we grade the work like any decision tool. Did buyers act differently because it exists?
An activity report counts motion. A Signal Card counts buyers
| What the report says | What the Signal Card says |
|---|---|
| 4,000 emails sent | Fit replies that booked a first call, against last month's baseline |
| 30 ads launched | Cost per booked call, with booked calls sent back from the CRM |
| 12 pages published | Share of a fixed set of buyer questions where AI answers cite you |
| About 20 hours saved | Hours timed before the build, next to the system's monthly cost |
Anar method
Marketing engineer KPIs: grade what buyers did, not what the system did
Every system a marketing engineer builds throws off two kinds of numbers. Activity counts what the system did: emails sent, ads launched, pages rewritten. Signal counts what a buyer did because of it: replied, booked, bought, came back.
Andy Grove drew this line in High Output Management. You judge a salesperson by the orders, he wrote, not by the calls. He called orders output and calls activity.
One question sorts any number. Could it go up while sales go down? If yes, it is activity.
The Lean Analytics authors add a second test. What will you do differently because this number moved? No answer means the number is decoration.
Big companies fall for this too. Intuit founder Scott Cook admits in Competing Against Luck that his teams measured whatever "rolled off our servers", and missed whether customers were better off. Amazon, the same book notes, counts orders delivered, not orders shipped.
A number that can only go up is a pat on the back. It is not a grade.

Seven numbers on a typical report. Five are clues, one is the driver, one is the grade
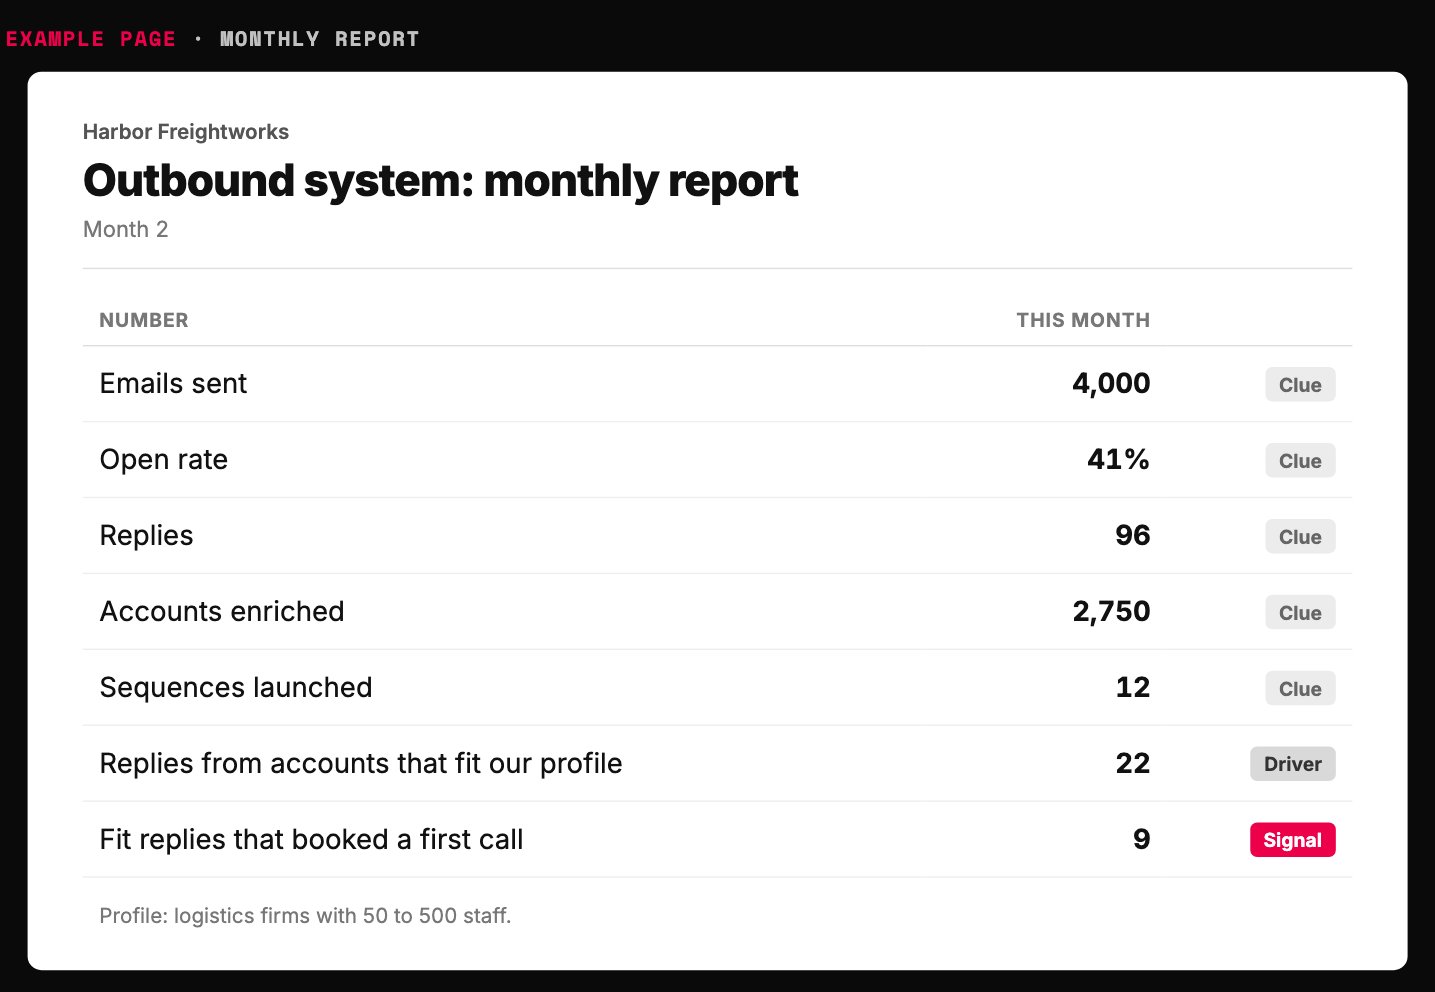
- Could it rise while sales fall? Yes. Send more to anyone. A clue, not the grade.
- Angry replies count here too. Still a clue.
- Closer: only buyers who fit. This is the driver.
- A buyer had to act. This is the one line to grade on.
Example page built for this article with a made-up company and made-up numbers.
Could the number rise while sales fall? Then it is a clue, not the grade
| Number | Could it rise while sales fall? | Use it as |
|---|---|---|
| Emails sent | Yes: send more to anyone | Clue |
| Replies | Yes: angry replies count too | Clue |
| Pages published | Yes: nobody has to read them | Clue |
| Share of buyer questions where AI answers cite you | Rarely: buyers see you more | Driver |
| Fit replies that booked a first call | Hard to: a buyer had to act | Signal (the grade) |
Anar method, built on High Output Management (output vs activity) and Lean Analytics (vanity vs actionable)
One card per system, read every Monday in under five minutes. Signal: one number that counts something a buyer did, defined in one sentence, shown against a baseline set by day 30 and a written day-90 forecast. Guardrail: the number the signal must not break.
Health: runs on schedule, approval rate, days to fix a break. Hours and cost: manual work returned, counted only for tasks timed before the build, next to the running cost. Clues: the activity counts, read only when the signal moves the wrong way.
Then one decision (keep, fix by a date, or kill) and one next test. No blended score.
Find the signal with the clone test
Not sure what the signal is? Run a thought experiment from How to Measure Anything in Cybersecurity Risk. Picture two identical companies, and give only one of them the system.
What would you see that is different? Write down every answer you could actually observe.
For an outbound email system: more replies from accounts that fit, more first calls booked, calls booked sooner. For a content system: buyers who name a post on the sales call.
The same book defines measurement as a drop in uncertainty, based on what you observe. It warns that activity, like who attended a security training, is not the result.
Swap the training for "prompts written" and the warning fits AI work too. That part is our reading.
Cannot name one thing you would see? Then the system has no job yet. Fix that before you build.
Picture two identical companies and list what would differ
- Clone the company Two identical businesses. Only one gets the system.
- List what you would see Replies, calls booked, buyers naming a post. Anything you could observe.
- Keep what you can count weekly Cross off anything you cannot count from a real source.
- Pick the one closest to a sale That is the signal. The rest become drivers or clues.
Thought experiment from How to Measure Anything in Cybersecurity Risk (Hubbard and Seiersen), applied to marketing systems by us
Rewrite a vanity count until pushing it moves sales
A vanity count is a number that looks like progress but cannot change a decision. Amazon learned the cost the hard way. Its retail teams were once graded on new product pages created, so they added thousands of items.
Sales did not rise. The cost of holding inventory did.
The fix, told in Working Backwards, took several rewrites. Pages became page views, then views of products in stock, then views of products in stock and ready for two-day shipping.
At every step the team asked one question. If we push this number, will the result we want follow? That is the whole trick.
We run the same rewrite on outbound. Emails sent becomes replies, then replies from accounts that fit a written profile, then fit replies that booked a first call.
Write the final definition in one sentence before anyone counts. Two people who know your market should read the same reply and reach the same verdict. If they do not, the definition is not finished.
Amazon rewrote a page count four times. Outbound needs the same treatment
| Amazon's selection number | Our outbound number |
|---|---|
| Number of new product pages | Emails sent |
| Product page views | Replies |
| Page views where the product is in stock | Replies from accounts that fit a written profile |
| In stock and ready for two-day shipping | Fit replies that booked a first call |
Left: Working Backwards (Bryar and Carr). Right: Anar method
Pair every number with the one it can break
Any number you grade will get pushed. Grove's answer was pairing: measure the effect and the counter-effect together. Inventory goes with shortages, and vouchers processed go with errors found.
The authors of Trustworthy Online Controlled Experiments sort numbers into three kinds. A goal number is what you finally care about. A driver number moves faster and predicts the goal.
A guardrail number is what you refuse to break. They also keep diagnostic numbers, used only to dig into a problem. That is where activity counts belong.
Skip the guardrail and you get the fast-food manager from the same book. He hit a perfect score on wasted chicken by cooking only after customers ordered.
He won the award. The long waits put the restaurant out of business.
Great number. Dead restaurant.
For outbound, the table below fills in all four. Volume is a clue, never the grade.
Grade on the goal, steer by the driver, never break the guardrail
| Kind | What it does | Outbound example |
|---|---|---|
| Goal | What you finally care about | Booked first calls with fit accounts |
| Driver | Moves faster and predicts the goal | Fit replies |
| Guardrail | What you refuse to break | Unsubscribes and spam complaints |
| Diagnostic (clue) | Used only to dig into a problem | Emails sent, open rate |
Taxonomy from Trustworthy Online Controlled Experiments (Kohavi, Tang and Xu); outbound examples are ours
Health: a system that does not run scores zero
A great signal from a system that ran twice is luck. So every system gets a health line under its signal.
Software teams already have a model. In the survey research behind Accelerate, Nicole Forsgren and her co-authors settled on four delivery measures. They track how long a change takes to go live, how often teams ship, how fast they recover from a failure, and how often a change breaks something.
The DORA metrics guide still teaches the same four.
Their high performers were faster and more stable at the same time. Speed or safety? They got both.
Our reading for marketing systems is in the table below: idea-to-live time, launches per month, days to fix a broken funnel, and the share of launches that needed a fix.
We add one line the software measures do not have: approval rate. That is the share of drafts a person approves without rewriting.
Say the approver rewrites 60 percent of drafts in week two and 15 percent in week eight. The system is learning. A flat rate means corrections are not being written into the agent's job spec; how to evaluate AI agents covers the tests.
The fastest teams were also the most stable
High performers compared with low performers, 2017 survey data
- more frequent deploys 46
- faster lead time 440
- faster recovery 170
- lower change fail rate 5
Accelerate (Forsgren, Humble and Kim), State of DevOps survey research. Software teams, not marketing; it shows correlation, not proof of cause
Four software health measures, rewritten for marketing systems
| Software measure | Marketing system version |
|---|---|
| Lead time | Days from approved brief to a live ad, page or email |
| Deploy frequency | Launches per month |
| Time to restore service | Days from a broken form or tracking tag to fixed |
| Change fail rate | Share of launches that needed a fix after going live |
| (no software version) | Approval rate: drafts a person approved without rewriting |
Left: Accelerate. Right: Anar method
Count hours saved the way a finance person would
Hours saved is the number most likely to be padded. Keep it anyway. Just give it rules.
Count only work someone already did, timed before the build. Take minutes per task and how often it ran over two weeks. Time the same task after launch.
Hours for work nobody did before are not saved. They are new work. They go under signal, if anywhere.
Google's site reliability engineers call the work being removed toil: manual, repetitive, automatable work that grows with the service. They aim to keep it under half of each engineer's time.
Turn that rule on the marketing engineer's own week. If more than half goes to keeping old systems alive, the role has slid into upkeep. System two never gets built.
Do not grade them on how busy they look, either. Queueing theory says that as a team nears 100 percent busy, wait times climb toward infinity. A marketing engineer with no slack fixes nothing fast.
Put the running cost on the same line as the hours. The chart below shows why.
Count hours saved only for work someone was already doing
- Time it before the build Minutes per task, and how often it ran, over two weeks.
- Time it after launch Same task, same method, including the time to check the output.
- Subtract Before minus after. New work nobody did before does not count.
- Add the cost Monthly running cost on the same line as the hours.
Anar method
Example: same 10 hours a week, a 20-fold gap in cost per hour
Monthly cost divided by about 43 hours returned a month (10 hours a week)
- System A, $900 a month 20.8
- System B, $40 a month 0.9
Example math: $900 / 43.3 hours = $20.80; $40 / 43.3 hours = $0.92
Why one blended score hides the truth
Sooner or later someone wants one number. Blend the signals into a single score, the thinking goes, and grade on that.
Amazon tried it. Teams got weighted formulas, like 50 percent of one number plus 30 of another plus 20 of a third.
They argued about the weights. Nobody could say what a rising line meant. Amazon went back to separate numbers, each with its own goal.
Every number is a stand-in for an idea. Keep several on the card and a broken one stands out.
Economists named what happens next. Goodhart's law, in its common form: once a number becomes the target, it stops being a good measure.
The Lean Analytics authors tell of a sales chief who paid bonuses on deals in the pipeline, not deals closed. The team chased the money. Cleaning out the junk leads took two quarters.
How to turn a marketing engineer into a spam cannon in four easy steps. Step one: pay them on emails sent. Step two: put replies in the bonus, with no definition of a reply.
Step three: drop the unsubscribe line because it looks bad in the deck. Step four: act surprised when your domain lands in spam. Congratulations, you built a damn efficient way to annoy people.
Every story in the table below hit its number. That was the problem.
Every one of these hit its target
| Who | Graded on | What broke |
|---|---|---|
| A record weightlifter | A bonus per world record | He broke records a gram or two at a time |
| A fast-food manager | Chicken waste | Cooked only after orders; the waits closed the restaurant |
| A spare parts team | Low inventory | Parts ran out and operations shut down |
| Amazon retail teams | New product pages | Sales flat, inventory cost up |
| A sales team | Deals in the pipeline | Two quarters cleaning out junk leads |
Trustworthy Online Controlled Experiments (citing Spitzer 2007); Working Backwards; Lean Analytics
When should you judge the results? After the lag, against a written forecast
Results trail the work. Grove once rated a manager superior after a superb year. The next year, the unit fell apart.
He decided the good numbers came from work done much earlier. He called them light from distant stars, and put the lag at about a year.
So write the forecast before the build. Our rule: by day 30, the signal has a one-sentence definition, a baseline from real data, and a written range for day 90.
The textbook that named the field grades models the same way. It reports one forecasting model tested on 44 new products: predicted market share averaged 7.77, actual share 7.16, with a 0.95 correlation. A forecast you can check is a forecast you can trust.
At the call, read health first, as the grid below shows. Health red with a flat signal means it never ran enough to judge: fix it and give it four more weeks.
Health green with a flat signal means it ran fine and buyers did not care. That is a kill.
Can you pin revenue on one person? No, and the card does not try. It asks whether one system's signal moved against its own baseline, and whether the next step in the funnel moved with it.
Grove's rule still applies, though. Rate the builder no higher than the output of the systems they run. The full first-quarter plan is in the first 90 days with a marketing engineer.
Read health first, then the signal
- Lucky It moved without running reliably. Fix health before you scale.
- Keep It ran and buyers acted. Plan system two.
- Not judged yet It never ran enough. Fix it, give it four more weeks.
- Kill It ran fine and buyers did not care.
Anar method
Write the forecast first, judge after the lag
- Time the task Before the build Minutes and frequency over two weeks.
- Define and baseline By day 30 One-sentence signal, a baseline from real data, a written day-90 range.
- Read the card Every Monday Five minutes. Signal against baseline, then health.
- Make the call Day 90 Keep, fix by a date, or kill, using the grid above.
Anar method
The Signal Card: seven lines, one screen, every Monday
The Signal Card is one card per system, read every Monday in five minutes. It has seven lines: signal, guardrail, health, hours and cost, clues, a decision, and the next test.
Two reads matter each week. Did the signal move against its baseline? Did last week's change move the number it aimed at?
If the signal fell, open the clues line. That is the only time activity earns a look. Steady sends with fewer fit replies point at the message, and fewer sends point at the system.
Where does the signal come from? For paid ads, the CRM sends booked calls back to the platform, as in server-side conversion tracking. For AI answers, it is a fixed set of buyer questions, rerun the same way every week.
Cards for every system roll up into one weekly memo in the growth cockpit. Selling on calls? Put the rates from book-a-call math under the card.
The signal should show up in those rates within a quarter. If it does not, it was further from revenue than it looked.
A filled-in Signal Card for one outbound system
| Line | This week | Notes |
|---|---|---|
| Signal | 5 fit replies that booked a call | Baseline 2 a week; day-90 forecast 4 to 8 |
| Guardrail | Unsubscribes 0.8% of sends | Line set at 2%; under it |
| Health | Ran 5 of 5 mornings | Approval rate 82% (41 of 50 drafts); no open breaks |
| Hours and cost | 6 hours returned | Timed before the build; $120 a month |
| Clues | 180 sent, 9 replies, 6 fit | Read only if the signal falls |
| Decision | Keep | One word, one owner |
| Next test | First line tied to the funding news | Aimed at fit replies |
Illustrative numbers for one outbound system
The whole card fits on one screen, and the signal line is read first
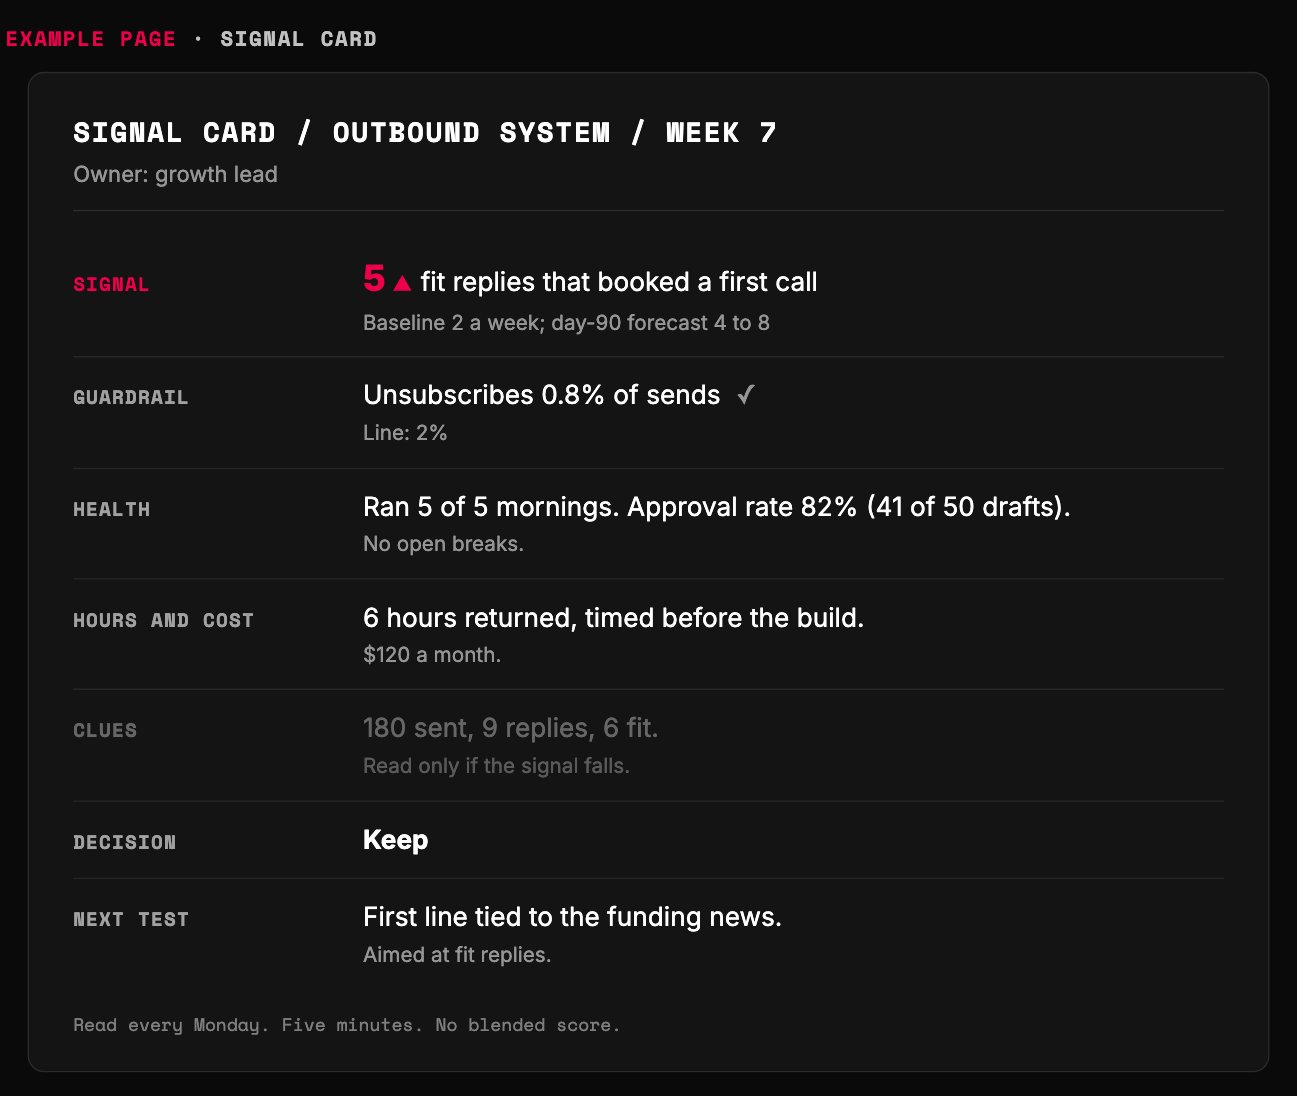
- Read this first. One number a buyer moved, against its baseline and forecast.
- The number the signal must not break.
- Did it run, and how much did a person have to fix?
- Activity lives here, greyed out. Open it only when the signal falls.
Example page built for this article. Same illustrative numbers as the filled-in Signal Card table above.
Build your Signal Card with AI
The prompt below builds a Signal Card for one system. Paste it into your preferred AI and answer seven questions. It shows its reasoning and never invents a number.
This week: first, run the clone test on your busiest system. Second, rewrite its main count until pushing it would move sales. Third, set the baseline and write the day-90 forecast.
Not sure which system deserves a card first? The marketing engineering audit finds it.
Want the card built in from day one? That is how our marketing engineering work runs.
Back to the 4,000 emails. The question was never how many went out. It was how many people wanted to buy.
Count the fish, not the casts.
Paste into your preferred AI. It asks seven questions, then gives you the signal, baseline, forecast, guardrail, health line and next test.
Act as a careful marketing analyst. Build a Signal Card for one marketing system I run. Use only my answers and the rules below. Never invent a number. If one is missing, ask me, or write MISSING.

Ask one at a time, show the example, and wait:
1. What the system does, in one sentence. (Example: finds companies that just raised money and drafts a first email)
2. Every number it reports today. (Example: emails sent, open rate, replies)
3. The result I finally want from it. (Example: booked first calls with companies that fit)
4. Who counts as a fit buyer, in one sentence. (Example: software firms with 20 to 200 staff)
5. Its numbers for the last four weeks, or 'none yet'. (Example: 900 sent, 40 replies, 6 fit replies, 3 calls)
6. Hours a week the task took by hand before the build, and how I timed it. (Example: 6 hours, timed for two weeks)
7. Its running cost per month. (Example: $120)

Rules:
- Clone test: list what I would see differently at an identical company without this system. The signal must come from that list.
- Sort every number in answer 2: could it rise while sales fall? If yes, it is a clue, not the grade.
- Rewrite the count until pushing it would move answer 3. Show each rewrite. Define the final signal in one sentence that two people would apply the same way.
- Add one guardrail the system must not break (unsubscribes, complaints, refunds, page speed).
- Health line: runs on schedule, approval rate (drafts a person approved without rewriting), days to fix a break.
- Count hours only if they were timed before the build. Put the monthly cost on the same line.
- No blended score. Every line stands alone.
- Baseline = answer 5, or the first four weeks of data. Write a day-90 forecast as a range, and say what result would mean kill.
- Never suggest more volume as the way to hit the signal.

Show your reasoning, then use exactly this format:
SIGNAL (one-sentence definition):
BASELINE:
DAY-90 FORECAST:
GUARDRAIL:
HEALTH:
HOURS AND COST:
CLUES:
DECISION RULE AT DAY 90:
NEXT TEST:
NEXT THREE ACTIONS:

Filip Kovacevic is the founder of Anar Agency in Phoenix. He spent five years running SEO, Meta ads, email, and content for medical practices across the United States, and now does the same work for healthcare, home-service, legal, and professional-service businesses, alongside AI implementation. More from Filip →
Want systems that come with the card attached?
Bring the number you want moved. In 15 minutes we will tell you which system we would build, what its signal would be, and how you would read it every Monday.
See how we build them →Want to do this work yourself? See how we train marketing engineers.