The Growth Cockpit: The Weekly Marketing Report That Replaces the Status Meeting

A weekly marketing report should fit on one page and make decisions, not just show numbers. Every line says what changed, the likely cause with proof, and the call: keep, stop or test, with an owner. Check the data first.
Report only finished tests. Grade last week's calls before making new ones.
What should a weekly marketing report include?
Monday, 9:30. Eight people are on a call. One of them shares a screen and reads the dashboard out loud for forty minutes.
Clicks are up. Cost per lead is down a bit. Nobody knows why, so the call ends the way it always ends: we will keep watching.
The dashboard was already watching. That was its whole job.
A weekly marketing report is the one page that tells your team what changed in marketing last week, why, and what to do next. Most teams picture a dashboard or a slide deck. We mean a memo that makes decisions.
We call ours the growth cockpit. It is one of the systems a marketing engineer builds: scripts pull the numbers, an AI drafts the memo, and a person signs it before Monday.
Here is the method in one breath. Every line says what changed, the likely cause with proof, and the call. Check the data before you explain anything, and grade last week's calls before you make new ones.
Get only a handful of leads a month? Run the same memo monthly. Weekly numbers that small are mostly noise.
A status meeting reads numbers; a Monday memo makes calls
| Status meeting | Monday memo |
|---|---|
| Numbers read aloud for forty minutes | Read in about two minutes before the call |
| Every wobble gets a theory | Wobbles inside the normal range are labelled noise |
| Causes are guesses | No receipt, no cause |
| Ends with "keep watching" | Ends with calls, owners and targets |
| Last week's decisions are forgotten | Last week's calls are graded |
Our method
Put the decision in the message, not behind a link
A dashboard waits for someone to open it. A memo shows up with the answer already inside. That small difference changes what people do.
The cleanest proof comes from government letters, not marketing. In Writing for Busy Readers, Todd Rogers and Jessica Lasky-Fink describe a test on 5,873 Medicare recipients choosing drug plans.
Half got a letter that pointed them to a website with their personal options. Half got a letter that printed those options, the cheapest plan and the savings. Switching to a better plan went from 17 percent to 28 percent.
Same facts. One group had to go and fetch them.
Donella Meadows tells an older story in Thinking in Systems. Identical Dutch houses used far less electricity when the meter sat in the front hall, where people walked past it, instead of the basement. She tells it as a story she heard, not a study, and so do we.
Our reading for marketing is simple. A dashboard is the meter in the basement. The Monday memo moves it to the front hall.
Who reads a dashboard aloud on purpose? Nobody. They do it because nobody wrote down what it meant.
Printing the options in the letter nearly doubled switching to a better plan
Medicare recipients who switched drug plans, by letter type, percent (5,873 people)
- Letter pointing to the website 17
- Letter with the options printed in it 28
Writing for Busy Readers, Rogers and Lasky-Fink, describing a government test (Kling and others, 2012)
Three times, moving information to where people look changed what they did
| Case | What changed | Result | How sure |
|---|---|---|---|
| Medicare drug-plan letters | Options printed in the letter, not behind a link | Plan switching 17% to 28% | Randomized test, 5,873 people |
| Dutch houses | Electric meter in the front hall, not the basement | Roughly a third less electricity | A story told to the author, not a study |
| US factory emissions (1986 law) | Emissions made public, with no fines | Reported emissions down 40% in two years | Reported figures, cited in the book |
Writing for Busy Readers (Rogers and Lasky-Fink); Thinking in Systems (Meadows), which gives the meter result as both one-third and 30 percent
Every line of the weekly memo carries three parts. The change: what moved, by how much, against last week and the average of the four weeks before, judged against its normal range (the lowest and highest of the last eight weeks); inside the range it is noise and gets no cause. The cause: the most likely reason, with a receipt, meaning a link, a quote or a log entry; no receipt, no cause.
The call: keep, stop or test, with an owner and a target for next Monday. Check data health before writing any cause, report only tests that reached their planned size, put anything that spends money as a yes-or-no question for the approver, and grade last week's calls in the last line so the memo learns.
Change-Cause-Call: every line makes a decision
We write every line of the memo with one rule: Change-Cause-Call. Three parts. Always in this order.
The change is what moved, by how much, and against what. The cause is the most likely reason, with a receipt: a link, a quote or a log entry. The call is keep, stop or test, with an owner and a target for next Monday.
Here is one line from a made-up kitchen remodeling company.
Booked estimates hit 31, above the eight-week high of 28. A text reply to every new lead within five minutes went live Tuesday, and leads reached within an hour rose to 81 percent from 52. Keep it; owner, the office manager; target, 30 or more next week.
The idea is older than AI. Gary Lilien and Arvind Rangaswamy coined the term marketing engineering for decisions built from data, models and judgment together, not gut feel alone.
Their textbook contrasts two managers. The first sees sales down 2.3 percent and asks for 10 percent more promotion money, quietly betting that more spend wins the sales back. The other feeds the new week into a model and names the spend that earns the most profit.
Today's marketing engineer goes one step further. We build the system that writes the second manager's answer every Monday.
The cause is where AI gets dangerous. Ask a model why a number moved and it will always find a reason. Like a TV pundit after a loss, it is never short of a theory.
Statisticians named this trap long ago: Twyman's law. The more surprising a number looks, the more likely the measurement broke.
So the rule stays short. No receipt, no cause.
Every line of the memo has three parts, in this order
- Change What moved, by how much, against last week and the four-week average. Inside the normal range it is noise: stop there.
- Cause The most likely reason, with a receipt: a link, a quote or a log entry. No receipt, no cause.
- Call Keep, stop or test. One owner, one target for next Monday.
Our method
Marketing engineering started as replacing a hunch with a written model
Paraphrased from the textbook that coined the term
| Without a model | With a model |
|---|---|
| Sales are down 2.3% against forecast | Sales are down 2.3% against forecast |
| Ask for 10% more promotion spend | Feed the new week into the sales response model |
| Silent guess: the spend wins the sales back | A 12.2% rise in promotion spend earns the most profit this quarter |
Principles of Marketing Engineering and Analytics, Lilien, Rangaswamy and De Bruyn, the Minneapolis example
Lead with one number and five or fewer that feed it
Most weekly reports fail before line one. They carry forty numbers, and nobody can watch forty numbers.
Start with the one number the business runs on: booked calls, signed jobs, paid orders. Alistair Croll and Benjamin Yoskovitz, in Lean Analytics, call it the One Metric That Matters: one number above all others for your current stage.
Their Moz example shows the shape. One headline number, new paying customers minus cancels, sat on top of a few numbers that fed it. Even so, an investor pushed the team to track fewer, because nobody can move dozens of numbers at once.
Then add the inputs that feed your one number, five at most. An input is something your team can push this week: leads, contact speed, show rate. Revenue arrives late and explains nothing on its own.
That split is the core of the weekly business review described in Working Backwards by Colin Bryar and Bill Carr. An output tells you growth slowed. An input like new customers tells you why, and much sooner.
Give every number one owner, a normal range and a target you can actually hit. A target nobody can reach turns red every week. A number that is always red works like a car alarm on a busy street: everyone stops hearing it.
Set targets from your best recent weeks, not your average. Meadows warns that goals tied to past performance slowly slide down until bad feels normal.
Forty numbers is not rigor. It is a hell of a place to hide.
Example: two numbers left their normal range; three are noise
Weekly scorecard for the made-up kitchen remodeling company. Normal range = lowest and highest of the last eight weeks
| Number | Owner | Normal range | This week | Last week | 4-week avg | Read |
|---|---|---|---|---|---|---|
| Booked estimates (the one number) | Sales lead | 20 to 28 | 31 | 22 | 25 | News: above range |
| New leads | Ads lead | 118 to 150 | 140 | 128 | 132 | Noise |
| Leads reached within an hour | Office manager | 45% to 60% | 81% | 52% | 52% | News: above range |
| Estimates that happened | Sales lead | 70% to 85% | 78% | 80% | 77% | Noise |
| Signed jobs (output, arrives late) | Owner | 4 to 8 | 6 | 5 | 6 | Noise |
Made-up kitchen remodeling company used as the example in this article. One owner per number follows Traction (Wickman); five numbers at most follows Clockwork (Michalowicz)
A number earns a place on the memo only if it passes all four tests
| Test | Ask | Fails it |
|---|---|---|
| Comparative | Can I see it against last week or another group? | "2% conversion" with nothing beside it |
| Understandable | Can the team remember it and argue about it? | A weighted health score nobody can explain |
| A ratio or rate | Is it per week, per lead, per visitor? | Total leads since launch |
| Changes behavior | What will we do differently if it moves? | A number nobody has ever acted on |
The four tests of a good metric in Lean Analytics, Croll and Yoskovitz; the failing examples are ours
Separate noise from news before explaining anything
Most weekly movement is noise. Numbers wobble for reasons nobody can fix, and explaining a wobble wastes everyone's morning.
Our rule is to show every number three ways: this week, last week, and the average of the four weeks before.
Then mark the normal range: the lowest and highest week of the last eight. Inside the range, the line says noise and moves on. Outside it, or three weeks in a row in one direction, it is news and earns a cause.
Amazon's review has a phrase for the first case: nothing to see here. A control chart does the same job with more math; our eight-week range is the simple version.
Check the data before you read it. A broken tag or a half-loaded day looks exactly like a great week. Even the Search Console API warns that its newest days may still change.
Tests get the same discipline. Report a test only when it reaches the size you set before it started.
Why so strict? Evan Miller showed that if you check a test after every visitor and stop at the first good result, a change that does nothing looks like a winner 26.1 percent of the time. You were told to expect 5.
Running tests get a name and a stop date. That is all.

Example: only week 9 left the normal range, so only week 9 gets a cause
Booked estimates per week, made-up kitchen remodeling company
- Booked estimates: W1 22, W2 24, W3 20, W4 28, W5 27, W6 26, W7 25, W8 22, W9 31
Made-up kitchen remodeling company used as the example in this article. Range from weeks 1 to 8
Checking a test after every visitor makes a dud look like a winner five times as often
Share of tests where a change that does nothing shows as a winner, percent
- What you expect at 5% significance 5
- Checked after every visitor, stopped at the first win 26.1
Evan Miller, How Not To Run an A/B Test (50% base rate, test capped at 150 visitors). Trustworthy Online Controlled Experiments (Kohavi, Tang and Xu) also says to read the trust checks before the result
The ten-line Monday memo, in reading order
The memo has ten lines and reads on a phone in about two minutes. The order matters.
Line 1 is the verdict: one sentence the boss could act on without reading further. That is the army's bottom line up front rule, applied to marketing.
Line 2 is data health, because everything below depends on it. Lines 3 to 6 are the evidence: the numbers, finished tests, what customers said and what your own team changed.
Finished tests come from your creative testing engine. What customers said comes from your customer truth system, with quotes and links.
Line 6 is the one teams skip. If nobody logged that the page headline changed Tuesday, nobody can explain Wednesday.
Lines 7 and 8 are the decisions. Line 8 holds anything that spends money, reaches customers or changes tracking, written as one yes-or-no question.
A narrow question gets a fast answer. "Approve moving $400 a week to search, yes or no?" gets a reply. "Thoughts on budget?" gets a meeting.
Line 9 is what moved outside: competitor launches, price changes, search positions. Line 10 grades last week's calls.
Bold one thing only: the verdict. In tests from Writing for Busy Readers, one highlighted instruction was followed by 84 percent of readers. Highlight five sentences and that drops to 65 percent.
If it needs scrolling, it is a newsletter.
The Monday memo: ten lines, verdict first, decisions last
| Line | What it says | Rule |
|---|---|---|
| 1. Verdict | What moved, why, and the one thing to do | One sentence. The only bold text |
| 2. Data health | Failed sources, incomplete days, tracking changes | Any problem here: read every line below with suspicion |
| 3. The numbers | The one number and up to five inputs | This week, last week, four-week average, noise or news |
| 4. Finished tests | Result and call for tests that reached their planned size | Running tests: name and stop date only |
| 5. What customers said | The objection or phrase that got louder | Two quotes with links |
| 6. What we changed | Ads, pages, emails, budgets, tracking, with dates | Without it, nobody can explain line 3 |
| 7. Calls | Keep, stop or test | One owner and one target each |
| 8. Needs your yes | Anything that spends money, reaches customers or changes tracking | One yes-or-no question each |
| 9. Outside | Competitor launches, price changes, search positions | Each with a link |
| 10. Last week graded | Did each call move its number? | Yes, no, or too early |
Our method
One highlighted line was followed most; highlighting five diluted it
Readers who followed an instruction in a five-paragraph passage, percent
- No highlighting 55
- Five sentences highlighted 65
- Only the instruction highlighted 84
Writing for Busy Readers, Rogers and Lasky-Fink, online study of nearly 1,000 readers
A finished Monday memo: verdict first, decisions last, last week graded
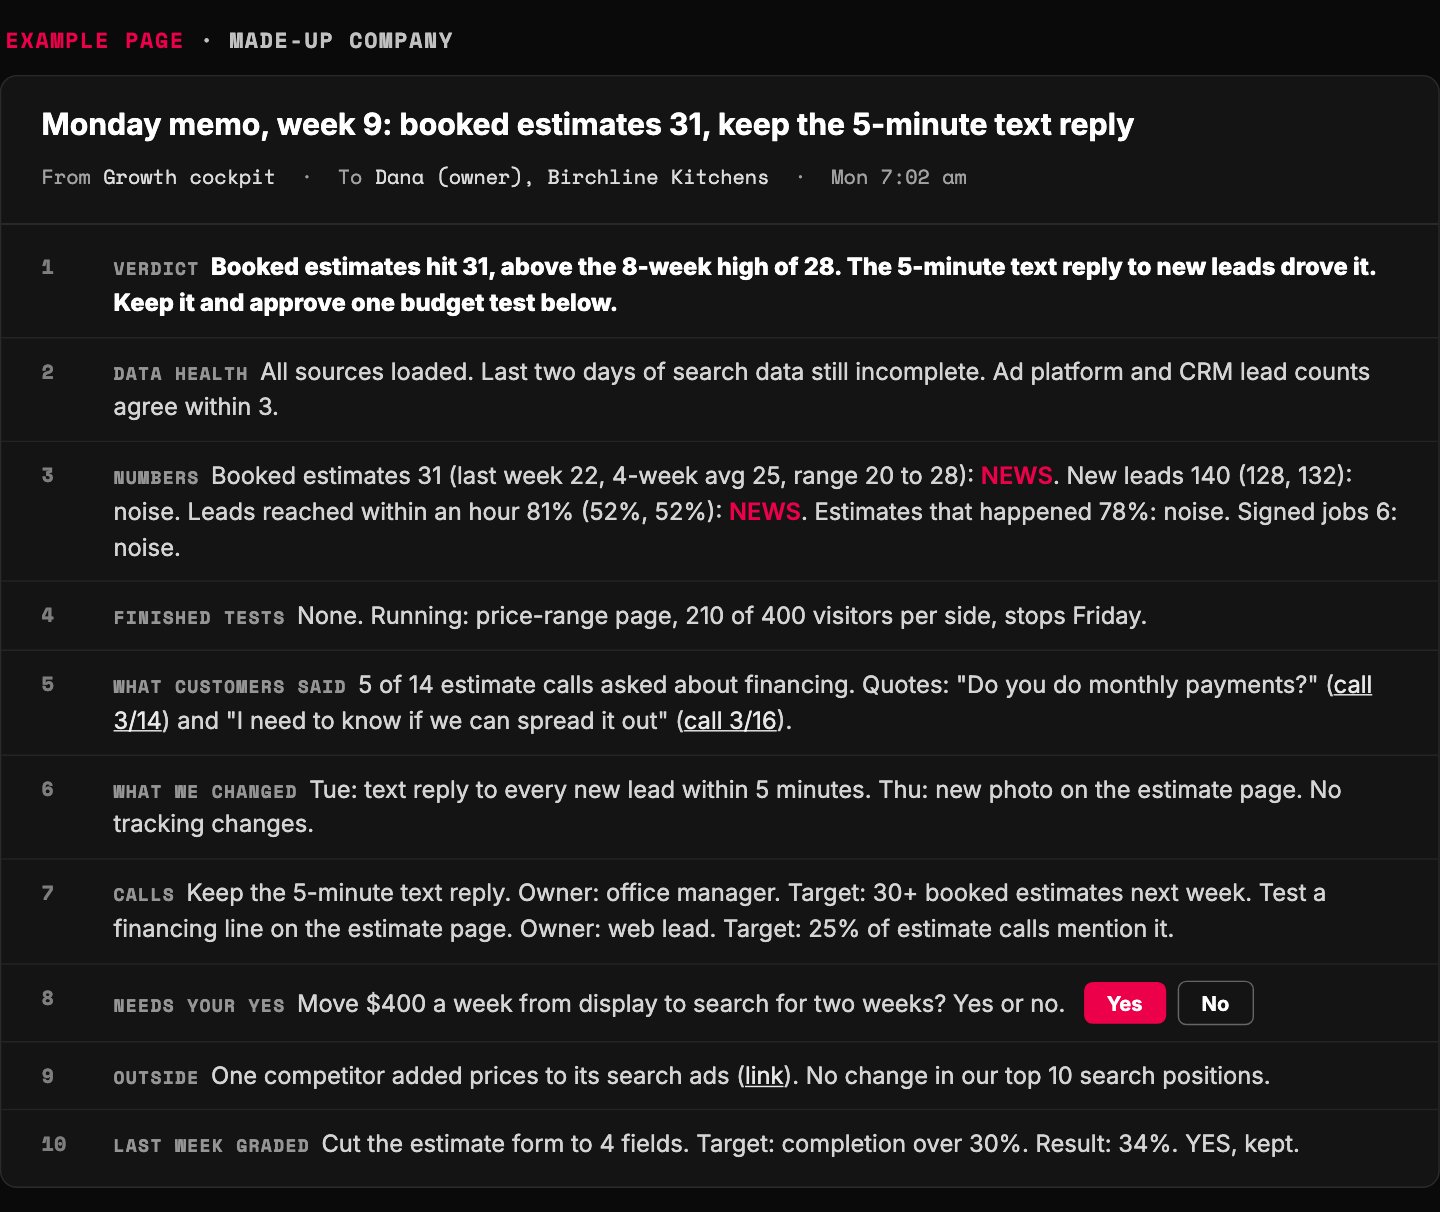
- The verdict comes first and is the only bold line.
- Data health sits above the numbers. A problem here means read everything below with suspicion.
- Only numbers outside their 8-week range get a cause.
- Anything that spends money is one yes-or-no question.
- Last week's call, graded. This is how the memo learns.
Example page built for this article with a made-up business and made-up numbers
Grade last week's calls, or the memo never learns
Line 10 turns a report into a system. Every call from line 7 goes into a dated decision log with its owner and target.
Next Monday the memo reads that log and grades each call: yes, no, or too early to tell. After a quarter you have twelve weeks of graded decisions instead of twelve weeks of slides.
Why bother? Unchecked promises die quietly.
Gino Wickman, author of Traction, saw it in his own client meetings. Of ten weekly promises, only a few got done. Once each one had to be reported the next week, nine of ten got done.
The approver's edits teach the memo too. Every cause they cut and every number they fix goes into the agent's rules file, so the same mistake does not come back next Monday.
Keep those rules concrete. "Ignore the last two days of search data" works. "Be careful with data" does nothing.
The rules file and the log live in your growth repo, next to the job specs. A chat window forgets. A folder does not.
Graded calls are what make the memo smarter every week
- Make the call Keep, stop or test, with an owner and a target.
- Log it Dated entry in the decision log.
- Grade it Next Monday: yes, no, or too early.
- Fix the rules Approver edits go into the agent's rules file.
Our method; reporting on each commitment a week later follows Traction (Wickman)
A decision log after four weeks: every call has an owner, a target and a grade
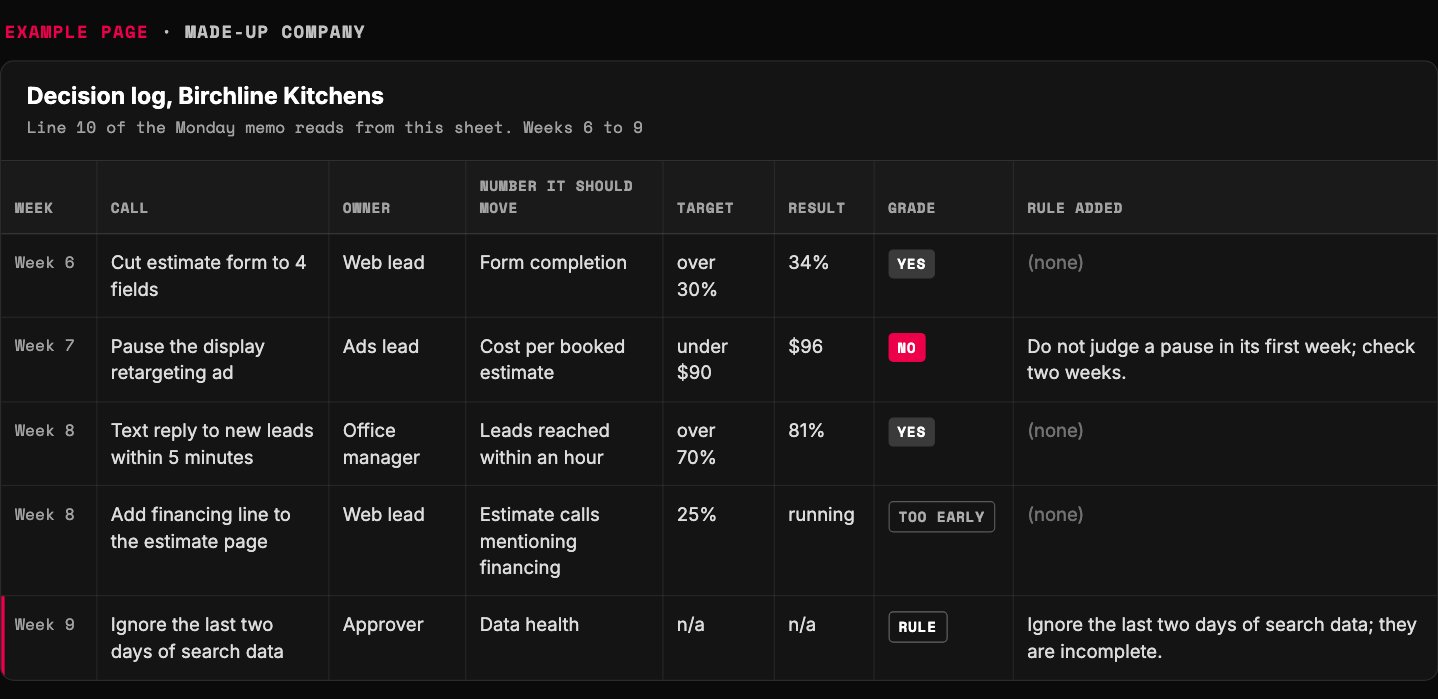
- Every call has one owner.
- The target is written before the week starts.
- A missed call is graded, not hidden.
- The approver's correction becomes a rule the agent reads next Monday.
Example page built for this article with a made-up business and made-up numbers
Let AI draft the memo and a person sign it
A marketing engineer can build the first version in about a day, if the data already sits in tools with exports. The order we use is below.
Give the agent read-only access. A memo writer has no reason to touch a budget, so the rule from our marketing engineering stack applies: read wide, write narrow.
Write the agent a job spec, not a one-line prompt. The format is in How to Write a Job Spec for an AI Agent.
Backtest before you schedule. Run it on last week, a week you already know, and count every wrong claim. Fix the spec and rerun until the count is zero.
Then keep a person in the pilot's seat. It is a cockpit, after all. Andy Grove argued in High Output Management that writing a report matters more than reading it, because writing forces you to be precise.
Our version for the AI era: the machine gathers and drafts. The owner of each number still rewrites its cause and its call. Skip that, and you outsource the thinking along with the typing.
The field's founding textbook drew a similar line: automate a decision only when a wrong one is cheap. A headline swap is cheap. A budget shift is not, which is why it waits in line 8.
Build the first cockpit in one working day, in this order
- Pick the one number Write its last eight weeks by hand. That is your baseline and your first normal range.
- List inputs and owners Up to five numbers that feed it, one owner each, and where each lives.
- Connect read-only Read-only keys or scheduled exports into one folder. No write access to any ad account or CRM.
- Start two logs A change log of what shipped, with dates, and a test log with planned size and stop date.
- Write the job spec Job, inputs, schedule, limits, the ten-line output, what needs approval.
- Backtest on last week Count wrong claims against the sources. Fix and rerun until the count is zero.
- Schedule it Runs Sunday night, lands before Monday's call.
- Name the approver One person signs. Start the decision log for line 10.
Our method
Cheap, reversible calls stay with the owner; costly ones wait for a yes
- Owner decides Example: swap a headline. Log it in line 6.
- Approver says yes Example: move $400 a week between campaigns. Line 8.
- Owner, after a second look Example: an email to the whole list.
- Not a memo call Example: change prices. Take it to a strategy meeting.
Our rule, after the automate-only-when-a-wrong-decision-is-cheap test in Principles of Marketing Engineering and Analytics and Amazon's split of weekly operations from strategy in Working Backwards
Does a weekly memo replace the Monday meeting?
Not entirely. It replaces the reading aloud, and it gives the meeting a better job.
Look at the weekly meeting in Traction. It runs 90 minutes, and only 20 of them are reporting: the numbers, the quarterly goals, the headlines and the to-do list. The other 60 go to solving problems.
The rule inside it is the one we keep: report, never discuss. Anything off track drops to the problem list for later in the meeting.
The memo does that reporting before anyone joins. So the call starts with line 8 and ends when every off-track number has an owner.
How to waste a Monday in four easy steps. Step one: share your screen. Step two: read every damn number aloud, including the ones that did not move.
Step three: explain each wobble with a confident theory nobody checks. Step four: end with "we will keep an eye on it" and book the same call for next week.
That is not a meeting. It is a very expensive screensaver.
Low volume changes the cadence, not the method. With only a few leads a week, run the memo every two or four weeks and compare equal periods.
In a 90-minute weekly meeting, 60 minutes go to solving problems
Minutes per agenda item in the Level 10 meeting
- Good news to start 5
- Scorecard numbers 5
- Quarterly goals 5
- Customer and staff headlines 5
- To-do list 5
- Solving problems 60
- Wrap-up 5
Traction, Gino Wickman, the Level 10 weekly agenda
Every good weekly format bans the same thing: talk about normal numbers
| Format | Prep before the room | Kept out of the room |
|---|---|---|
| Amazon weekly business review | Owners study their numbers and explain variances | Strategy, and praise for normal results |
| Level 10 meeting | Scorecard filled in, one owner per number | Discussion during the reporting part |
| Growth meeting | Monday review of tests and key metrics | Brainstorming |
| Our Monday memo | Data check and draft on Sunday night | Any cause without a receipt |
Working Backwards (Bryar and Carr); Traction (Wickman); Hacking Growth (Ellis and Brown); our method
Run your first Monday memo this week
The prompt below drafts the memo for you. Paste it into your preferred AI with last week's numbers, your change log and your test log. It asks for anything missing and never guesses a number.
This week: pick the one number and write its last eight weeks by hand. Then list what your team changed last week, with dates. Then run the prompt and have each number's owner rewrite its cause and call.
If the ad numbers in your memo look strange, read Read 'Results', Not 'Leads' before you trust them. If you would rather have the cockpit built, it is part of our marketing engineering work.
Back to that Monday call. The dashboard never needed a narrator. It needed one page that said what changed, why, and what to do.
A number without a cause and a call is wallpaper.
Paste into your preferred AI. It asks eight questions, then writes the ten-line memo with its math shown.
Act as my marketing analyst. Draft this week's Monday memo using the Change-Cause-Call rule. Use only the data I give you. Never invent a number, a cause or a quote; if something is missing, ask me.

Ask one at a time, show the example, and wait:
1. The one number the business runs on, last 9 weeks, newest last. (Example: booked estimates 22, 24, 20, 28, 27, 26, 25, 22, 31)
2. Up to five numbers that feed it, same 9 weeks, each with its owner. (Example: new leads, owner ads lead, ...)
3. What your team changed last week, with dates. (Example: Tuesday, text reply to new leads within five minutes)
4. Tests: name, planned size, current size, result if finished. (Example: price-range page, 400 visitors per side planned, 210 now)
5. What customers said, from calls, tickets or reviews, with links or quotes. (Example: 5 of 14 calls asked about financing)
6. Data problems: failed sources, incomplete days, tracking changes. (Example: last two days of search data incomplete)
7. Outside moves: competitor launches, price changes, search positions, with links. (Example: none)
8. Last week's calls, each with owner and target. (Example: cut the form to four fields, target completion over 30%)

Rules:
- Data health first. If a source failed, mark its lines UNSAFE and write no cause for them.
- Show each number three ways: this week, last week, average of the four weeks before.
- Normal range = lowest and highest of the 8 weeks before this one. Inside it: NOISE, no cause. Outside it, or 3 weeks in a row in one direction: NEWS.
- Every NEWS line: the change, the cause with a receipt from my answers, and the call (keep, stop or test) with owner and target. No receipt: write CAUSE UNKNOWN and the next check.
- Report only tests that reached their planned size. Running tests: name and stop date only.
- Anything that spends money, reaches customers or changes tracking goes under NEEDS YOUR YES as one yes-or-no question.
- Grade each of last week's calls: YES, NO or TOO EARLY.

Show your math, then use exactly this format:
VERDICT:
DATA HEALTH:
NUMBERS:
FINISHED TESTS:
WHAT CUSTOMERS SAID:
WHAT WE CHANGED:
CALLS:
NEEDS YOUR YES:
OUTSIDE:
LAST WEEK'S CALLS GRADED:

Filip Kovacevic is the founder of Anar Agency in Phoenix. He spent five years running SEO, Meta ads, email, and content for medical practices across the United States, and now does the same work for healthcare, home-service, legal, and professional-service businesses, alongside AI implementation. More from Filip →
Want the cockpit built for you?
Bring the one number your business runs on. In 15 minutes we will tell you which inputs the memo needs and what your first Monday memo would likely say.
See how we build them →Want to do this work yourself? See how we train marketing engineers.