Google Search vs AI Assistants: Where Buyers Actually Ask the Question

Buyers use both, and the split depends on the topic. Count how often people ask AI assistants about a topic each month, and divide by its monthly Google searches. Under 0.2, people mostly search, so win the list of results.
Over 1.0, people mostly ask, so answer the question directly. In between, one page must do both.
Search is dying, and Google is bigger than ever
Two headlines land in your feed on the same morning. One says search is dying, because everyone asks AI now. The other says Google is bigger than ever.
Both come with charts. Both charts are real. So which one do you plan your content around?
Neither. The split between Google Search and AI assistants does not depend on the year. It depends on the topic, and you can measure it.
We measured it on four topics we write about. Three were mostly searched. One was asked of AI assistants more than three times as often as it was searched.
That one changed what we build. This guide gives you the same measurement and the page each result calls for.
Each headline is true, but only for one kind of topic
| The headline | Where it holds |
|---|---|
| "Search is dying, everyone asks AI now" | Topics people describe in a long question |
| "Google is bigger than ever" | Topics people look up with a short phrase |
Anar's reading of the Ask-Ratio data in this article.
Is AI search replacing Google search?
Not by volume. Google still handles far more searches than all AI assistants combined, and the current counts sit in the dated box near the end.
But Google itself now answers many questions on the results page. A summary appears above the links. Fewer people click through.
What decides whether that summary shows up? Mostly the shape of the question.
Pew Research Center tracked the browsing of 900 adults. One- and two-word searches rarely produced an AI summary. Searches of ten words or more produced one about half the time.
So the real split is not Google against AI. It is short phrases against long questions.
A short phrase ends in a list of links. A long question ends in an answer, inside Google or inside an assistant.
Good news, then. You do not need to guess where your buyers went. You need to know which kind of question your topic is.

Long questions get an AI summary in Google; short phrases mostly do not
Share of Google searches that produced an AI summary, by type of search
- 1 or 2 words 8
- 10 words or more 53
- Starts with who, what, when or why 60
Source: Pew Research Center, browsing data from 900 US adults, March 2025.
For each topic you sell around, add up its phrase variants, then divide monthly AI assistant asks by monthly Google searches. Read it as a range: up to five months, from two tools if you can, lowest to highest. Under 0.2 it is a search topic: build to win the list, with the exact phrase in the title and the options side by side.
From 0.2 to 1.0 it is mixed: one page with a short direct answer up top and question headings below. Over 1.0 it is an asked topic: answer in the first two sentences, use your own numbers, and make every section stand alone. If the range crosses a line, build the mixed page.
Recheck every six months and move a page only when its topic changes band.
The Ask-Ratio: one number per topic shows where buyers ask
The Ask-Ratio is a topic's monthly AI assistant asks divided by its monthly Google searches. Asks are the questions people type into an AI assistant about that topic. Some keyword tools now estimate both numbers.
Why a ratio and not two totals? The authors of Lean Analytics make the case that the best metrics are ratios. A ratio compares by design, and you can act on it.
Their test for any metric is simple. If it moves, what will you do differently?
Two totals tell you size. The ratio tells you which page to build.
They also say to draw your line in the sand before the data comes in. So set the bands first, then pull the numbers.
Under 0.2: a search topic. For every ten searches, fewer than two people ask. Win the list of results.
0.2 to 1.0: a mixed topic. The same buyer searches the short version and asks the long one. One page has to rank and be quotable.
Over 1.0: an asked topic. More people ask than search. Win the answer.
The lines are ours. They are a working rule, not a law. At 1.0 both places are even, and below 0.2 the asking crowd is too small to plan a page around.
Five steps turn two keyword numbers into one decision
- Group the phrases Every variant of one topic goes in one row.
- Pull Google searches Monthly volume for each variant, added together.
- Pull AI asks Monthly AI assistant volume for the same variants.
- Divide AI asks divided by Google searches.
- Place it in a band Under 0.2, 0.2 to 1.0, or over 1.0.
Anar's method.
Each band calls for a different page
- Under 0.2: search topic Win the list of results.
- 0.2 to 1.0: mixed topic One page that ranks and can be quoted.
- Over 1.0: asked topic Win the answer.
Anar's bands, a working rule.
We measured four of our topics, and one flipped
Here is the audit on four topics we cover. The numbers are monthly US estimates from one keyword data provider.
"AI consultant" looks like a search topic. 8,100 Google searches a month against 717 AI asks. Ratio 0.09.
People want a list of firms to compare. A results page is a list.
"AI transformation" and "AI compliance" are mixed. Ratios of 0.32 and 0.44. That is about one ask for every two or three searches.
"AI operations" flipped. 320 Google searches a month against 1,079 AI asks. Ratio 3.4.
More than three people asked for every one who searched.
Same industry. Same buyers. Opposite answer.
Four topics are not a study. They are enough to kill the idea that one answer fits your whole business.
One topic is asked of AI assistants 3.4 times as often as it is searched
Ask-Ratio: monthly AI assistant asks divided by monthly Google searches
- ai operations 3.4
- ai compliance 0.44
- ai transformation 0.32
- ai consultant 0.09
Source: Anar's pull of DataForSEO Google and AI-assistant volume, United States, July 2026.
Same industry, two places, opposite answers
| Topic | Google searches a month | AI asks a month | Ask-Ratio | Band |
|---|---|---|---|---|
| ai consultant | 8,100 | 717 | 0.09 | Search |
| ai transformation | 1,000 | 324 | 0.32 | Mixed |
| ai compliance | 880 | 390 | 0.44 | Mixed |
| ai operations | 320 | 1,079 | 3.4 | Asked |
Source: Anar's pull of DataForSEO volumes, United States, July 2026. Estimates, not counts.
Read the ratio as a range, because the tools disagree
Here is the catch the headlines skip. Keyword tools estimate. They do not count.
We checked "AI consultant" in a second tool. It showed 3,300 Google searches a month, not 8,100.
Same phrase. Two tools. One estimate is more than double the other.
So the Ask-Ratio is 0.09 with one tool and 0.22 with the other.
That range crosses our 0.2 line. Is the measurement useless, then? No.
In How to Measure Anything in Cybersecurity Risk, Douglas Hubbard and Richard Seiersen define measurement as any observation that cuts your uncertainty. It never has to be exact to be worth taking.
Before the check, you had no idea where buyers ask about this topic. After it, you know it sits between 0.09 and 0.22. That is enough to decide.
Our rule: if the whole range sits inside one band, build for that band. If it crosses a line, build the mixed page, because it serves both sides.
How many readings do you need? Fewer than you think. The book's rule of five says that in a random sample of five, the true middle value lands between your lowest and highest reading about 94 percent of the time.
Months are not a perfect random draw, since some topics have seasons. So treat it as a rough guide. Pull five months from two tools if you can, then keep the lowest and highest ratio.
A second tool turned one search topic into a mixed one
| Topic | Ratio, tool A | Ratio, tool B | Range | What to build |
|---|---|---|---|---|
| ai consultant | 0.09 | 0.22 | 0.09 to 0.22 | Mixed page (range crosses 0.2) |
| ai transformation | 0.32 | 0.20 | 0.20 to 0.32 | Mixed page |
| ai compliance | 0.44 | 0.23 | 0.23 to 0.44 | Mixed page |
| ai operations | 3.4 | No Google figure | One reading | Answer page, recheck soon |
Source: Anar's pull, United States, July 2026. Tool A: DataForSEO Google and AI volume. Tool B: Ahrefs Google volume, divided into tool A's AI asks.
Five readings are enough for a usable range
- random readings of the same number 5
- chance the true middle value lies between your lowest and highest reading 93.75
Source: Hubbard and Seiersen, How to Measure Anything in Cybersecurity Risk, 2nd edition (Wiley), Rule of Five.
A finished Ask-Ratio audit: two tools, a range per topic, and the band that range decides
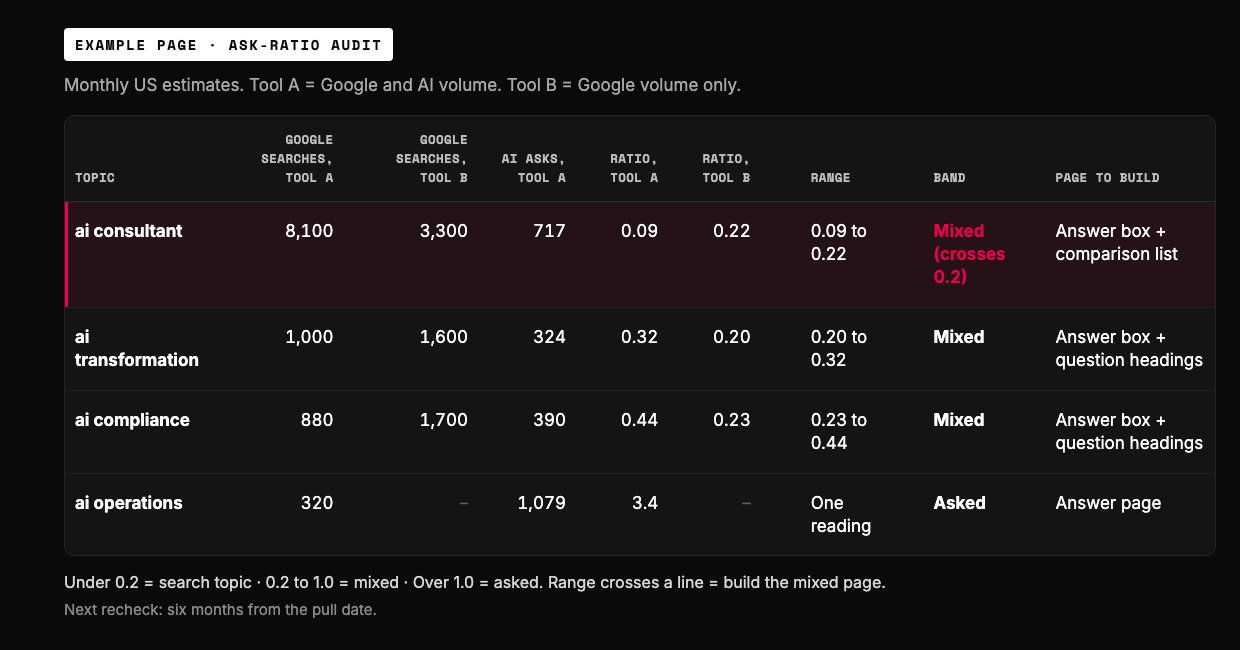
- Two tools, one phrase, a gap of more than double.
- Read it as a range, lowest to highest.
- The range crosses a line, so the page has to win the list and the answer.
- One reading only. Treat it as rough and recheck.
Example page built for this article. Numbers are Anar's July 2026 pull, United States: DataForSEO Google and AI-assistant volume (tool A) and Ahrefs Google volume (tool B), taken 2026-10-18.
Why some topics get asked instead of searched
Our explanation starts with where the buyer is on the road to a purchase. Bob Moesta's Demand-Side Sales 101 maps that road in stages, and two of them matter here.
Passive looking is the stage where a person feels the problem but has no plan. They are learning the problem and the words for it.
Active looking starts once they set aside time or money to fix it. Now they gather facts and compare options.
The next part is our reading, not the book's claim. Passive lookers describe. Active lookers compare.
Someone who describes writes a paragraph about their own company. That is an ask.
Someone who compares types two words and wants a list. That is a search.
It fits our four topics. "AI operations" is a mess you describe. "AI consultant" is a shortlist you compare.
So a high ratio may also mean your buyers are early and still learning. Check that guess against your own sales calls before you bet a quarter on it.
People who describe tend to ask; people who compare tend to search
| Passive looking | Active looking |
|---|---|
| Feels the problem, has no plan yet | Has set aside time or money to fix it |
| Learning the words for the problem | Comparing named options |
| Writes a long description | Types a short phrase |
| Wants an explanation | Wants a list |
| Our guess: a higher Ask-Ratio | Our guess: a lower Ask-Ratio |
Stages from Moesta, Demand-Side Sales 101. The last three rows are Anar's reading.
The same buyer asks a different question at each stage
- Something feels off First thought "Why does every AI pilot we start fizzle out after a month?"
- Learning the problem Passive looking "How do companies our size run AI in daily operations?"
- Comparing options Active looking "ai consultant"
- Checking one choice Deciding "[firm name] reviews"
Example questions written by Anar. Stage names from Demand-Side Sales 101.
Build the page each band calls for
Each band gets one page type. There are no extra technical requirements for Google's AI features, and the usual SEO basics still apply. So the work is what goes on the page, not a secret switch.
Search topic: put the exact phrase in the title. Show the options side by side. Then earn the links that move you up, which is the subject of the Page-2 Problem.
Mixed topic: open with a short, direct answer. Then let the headings carry the questions buyers ask. One page, two jobs.
Asked topic: answer in the first two sentences. Use your own numbers. Make every section make sense alone, because an assistant may lift one section and skip the rest.
Google's own advice on helpful, people-first content points the same way. Write for the person asking, not for the engine.
Which sources do assistants actually quote? We counted them in what AI answer engines actually cite. To see whether they name you, use the AI search visibility system.
A page built for the wrong band can still be a good page. It just answers a question nobody there is asking.
Match the page to the band, not to the trend
| Band | The page must win | First screen | Proof that works |
|---|---|---|---|
| Search topic (under 0.2) | A spot in the list | The exact phrase in the title, options side by side | Comparisons, prices, reviews |
| Mixed topic (0.2 to 1.0) | The list and the answer | A short direct answer, then question headings | Your own numbers plus comparisons |
| Asked topic (over 1.0) | The answer | The answer in the first two sentences | Your own data and sources |
Anar's method.
One page built for a mixed topic can win the list and the answer
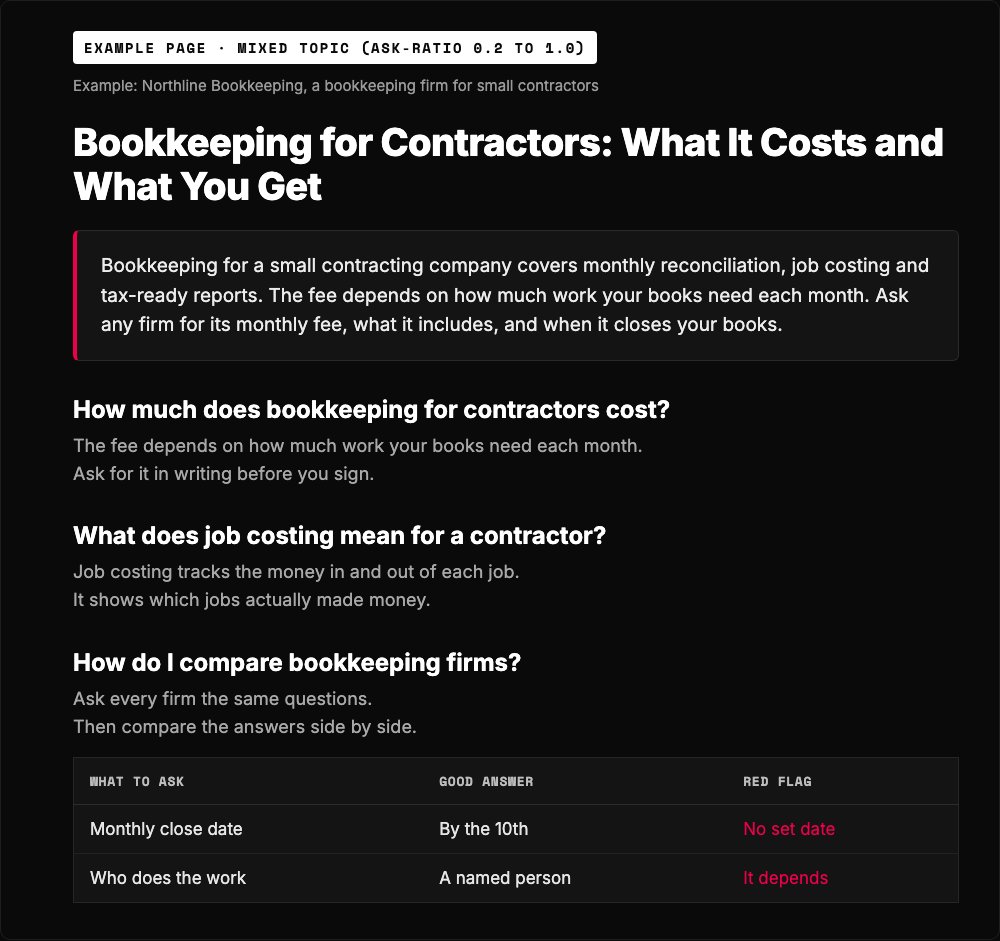
- First screen: the direct answer, in three sentences an assistant can quote.
- The exact search phrase sits in the title, so the page can rank in the list.
- Headings carry the questions buyers ask, each one answered in its first line.
- The comparison block serves the buyer who is still shopping.
Example page built for this article with a made-up brand, 2026-10-18.
Picking a side is the most expensive way to get this wrong
How to waste a year of content in four easy steps:
1) Read one headline about AI search.
2) Rewrite every page for AI assistants, including the ones people only ever search.
3) Never measure a single topic.
4) When traffic drops, blame the algorithm.
That is not a strategy. That is a mood swing with a budget.
Our take: the loudest voices in this debate usually sell one side of it. Search shops say search is fine, and AI visibility vendors say search is dying.
Both pitches skip the same step. Neither one looked at your topics. That skipped step is the bullshit you end up paying for.
Picking a side costs a year; measuring costs an afternoon
| Pick a side | Measure per topic |
|---|---|
| Rewrite everything for AI, or for Google | Rewrite only pages in the wrong band |
| Plan from headlines | Plan from your own topics |
| Blame the algorithm | Recheck every six months |
Anar's take.
Four places the audit goes wrong, and the fix
Your tool shows zero AI asks. Zero in one tool is not zero demand. Many tools have no AI volume at all, and small topics fall below their floor.
The fix is other sources. You have more data than you think: the questions on your sales calls, in your contact forms and in your site search. Our customer truth system shows how to collect them.
You measured a phrase, not a topic. "AI ops" and "AI operations" are one topic. Add the variants together before you divide.
You trusted one month. A single month can catch a spike or a slump. Use five, and read the range.
The ratio moved and nobody noticed. Chip Huyen points out in AI Engineering that users learn to phrase queries to get better results, the way they did with Google. Phrasing shifts, and the ratio shifts with it.
So a ratio is a reading, not a fact. It is a weather report, not a birth certificate.
Four problems, and the fix for each
| Symptom | Cause | Fix |
|---|---|---|
| Zero AI asks | The tool has no AI volume, or the topic is below its floor | Use sales-call, form and site-search questions |
| Odd, tiny numbers | One phrase measured instead of the topic | Add the variants before you divide |
| A ratio that flips next month | One month caught a spike | Five months, read as a range |
| Pages built for an old band | Phrasing moved and nobody rechecked | Recheck every six months |
Anar's method.
Recheck twice a year, because the places people ask can move fast
The places people ask can change faster than most content plans. Principles of Marketing Engineering and Analytics, by Gary Lilien, Arvind Rangaswamy and Arnaud De Bruyn, shows that Facebook was missing from the top ten US web brands at the end of 2007.
By 2016 it ranked third. Nine years took it from absent to near the top.
Will AI assistants move that fast? Nobody knows. That is exactly why you measure instead of guess.
Our rule is a recheck every six months. Same topics, same tools, same bands.
When a topic changes band, change its page. When it does not, leave the page alone and spend the time elsewhere.
The numbers that change with every study sit in the box below, with their dates. The method above does not depend on any of them.
Facebook was missing from the 2007 top ten; by 2016 it ranked third
US unique visitors across devices, August 2016, millions
- Google sites 240.7
- Yahoo sites 213.3
- Facebook 206.3
- Microsoft sites 188.8
- Amazon sites 186.3
Source: Lilien, Rangaswamy and De Bruyn, Principles of Marketing Engineering and Analytics, 3rd edition, Exhibit 8.5 (comScore, August 2016; Nielsen, December 2007).
Run the Ask-Ratio audit with AI this week
The prompt below runs the whole audit in your preferred AI. It asks for your topics and your numbers and never invents one. You get a range, a band and a page type for each topic.
This week, do three things. List your ten main topics. Pull five months of Google searches and AI asks for each, from two tools if you can.
Run the prompt. Then fix one page first: the one that is the worst match for its topic's band.
Put a recheck in your calendar six months out. If you want a second pair of eyes, our SEO team runs this audit as part of every content plan, and hub and spoke SEO shows how to group the topics first.
Remember the two headlines? Both were right. Each was right about a different kind of topic.
So stop arguing about which road your buyers take. Count the cars on each one.
Paste into your preferred AI. It asks for your topics and numbers, then returns a range, a band and a page type for each topic.
Act as a careful search analyst running the Ask-Ratio audit.

Ask me these one at a time, each with its example. If I give you everything at once, skip the questions and start.
1. My topics, each with its phrase variants. (Example: "AI operations: ai operations, ai ops, ai operations consulting")
2. Monthly Google searches for every variant, from one or two keyword tools, for up to five months. (Example: "Tool A: 320, 290, 350")
3. Monthly AI assistant asks for every variant, if my tool shows them. (Example: "1,079")
4. The page I have now for each topic, if any. (Example: "a list of firms")

Then:
1. Add the variants of each topic together before you divide.
2. For each month and each tool, divide AI asks by Google searches. Show the math.
3. Report the lowest and highest ratio as the range. With fewer than five readings, say the range is rough.
4. Place each range in a band: under 0.2 = search topic, 0.2 to 1.0 = mixed topic, over 1.0 = asked topic. If the range crosses a line, call it mixed.
5. Give one page type per topic. Search topic: the exact phrase in the title and the options compared side by side. Mixed topic: a short direct answer at the top, then question headings. Asked topic: the answer in the first two sentences, my own numbers, and sections that each make sense alone.
6. Compare each with my current page and flag every mismatch.

Rules:
- Never invent a volume. If a number is missing, write [NEED: which number and from which tool].
- Zero AI asks in a tool is not zero demand. Ask me for the questions buyers raise on sales calls, in forms and in site search instead.
- If you can browse, check my keyword tool's help pages for how it estimates AI volume, and tell me what you found.

Output:
A. A table: topic, range, band, current page, recommended page.
B. The one page to fix first, and why.
C. Every [NEED] item, numbered.
D. A recheck date six months from today.

Filip Kovacevic is the founder of Anar Agency in Phoenix. He spent five years running SEO, Meta ads, email, and content for medical practices across the United States, and now does the same work for healthcare, home-service, legal, and professional-service businesses, alongside AI implementation. More from Filip →
Talk it through in 15 minutes
Bring one question from this article. We will tell you what we would do, whether or not you hire us.
Book a 15-Min Chat →